Mapping the employee lifecycle
The work began by mapping how access changes over an employee's time at a company: joining, requesting new access, certification reviews, and changing departments. Pain points along the map pointed to where a new tool could help. Designs were then reviewed with the team and stakeholders on a large screen beside the map.



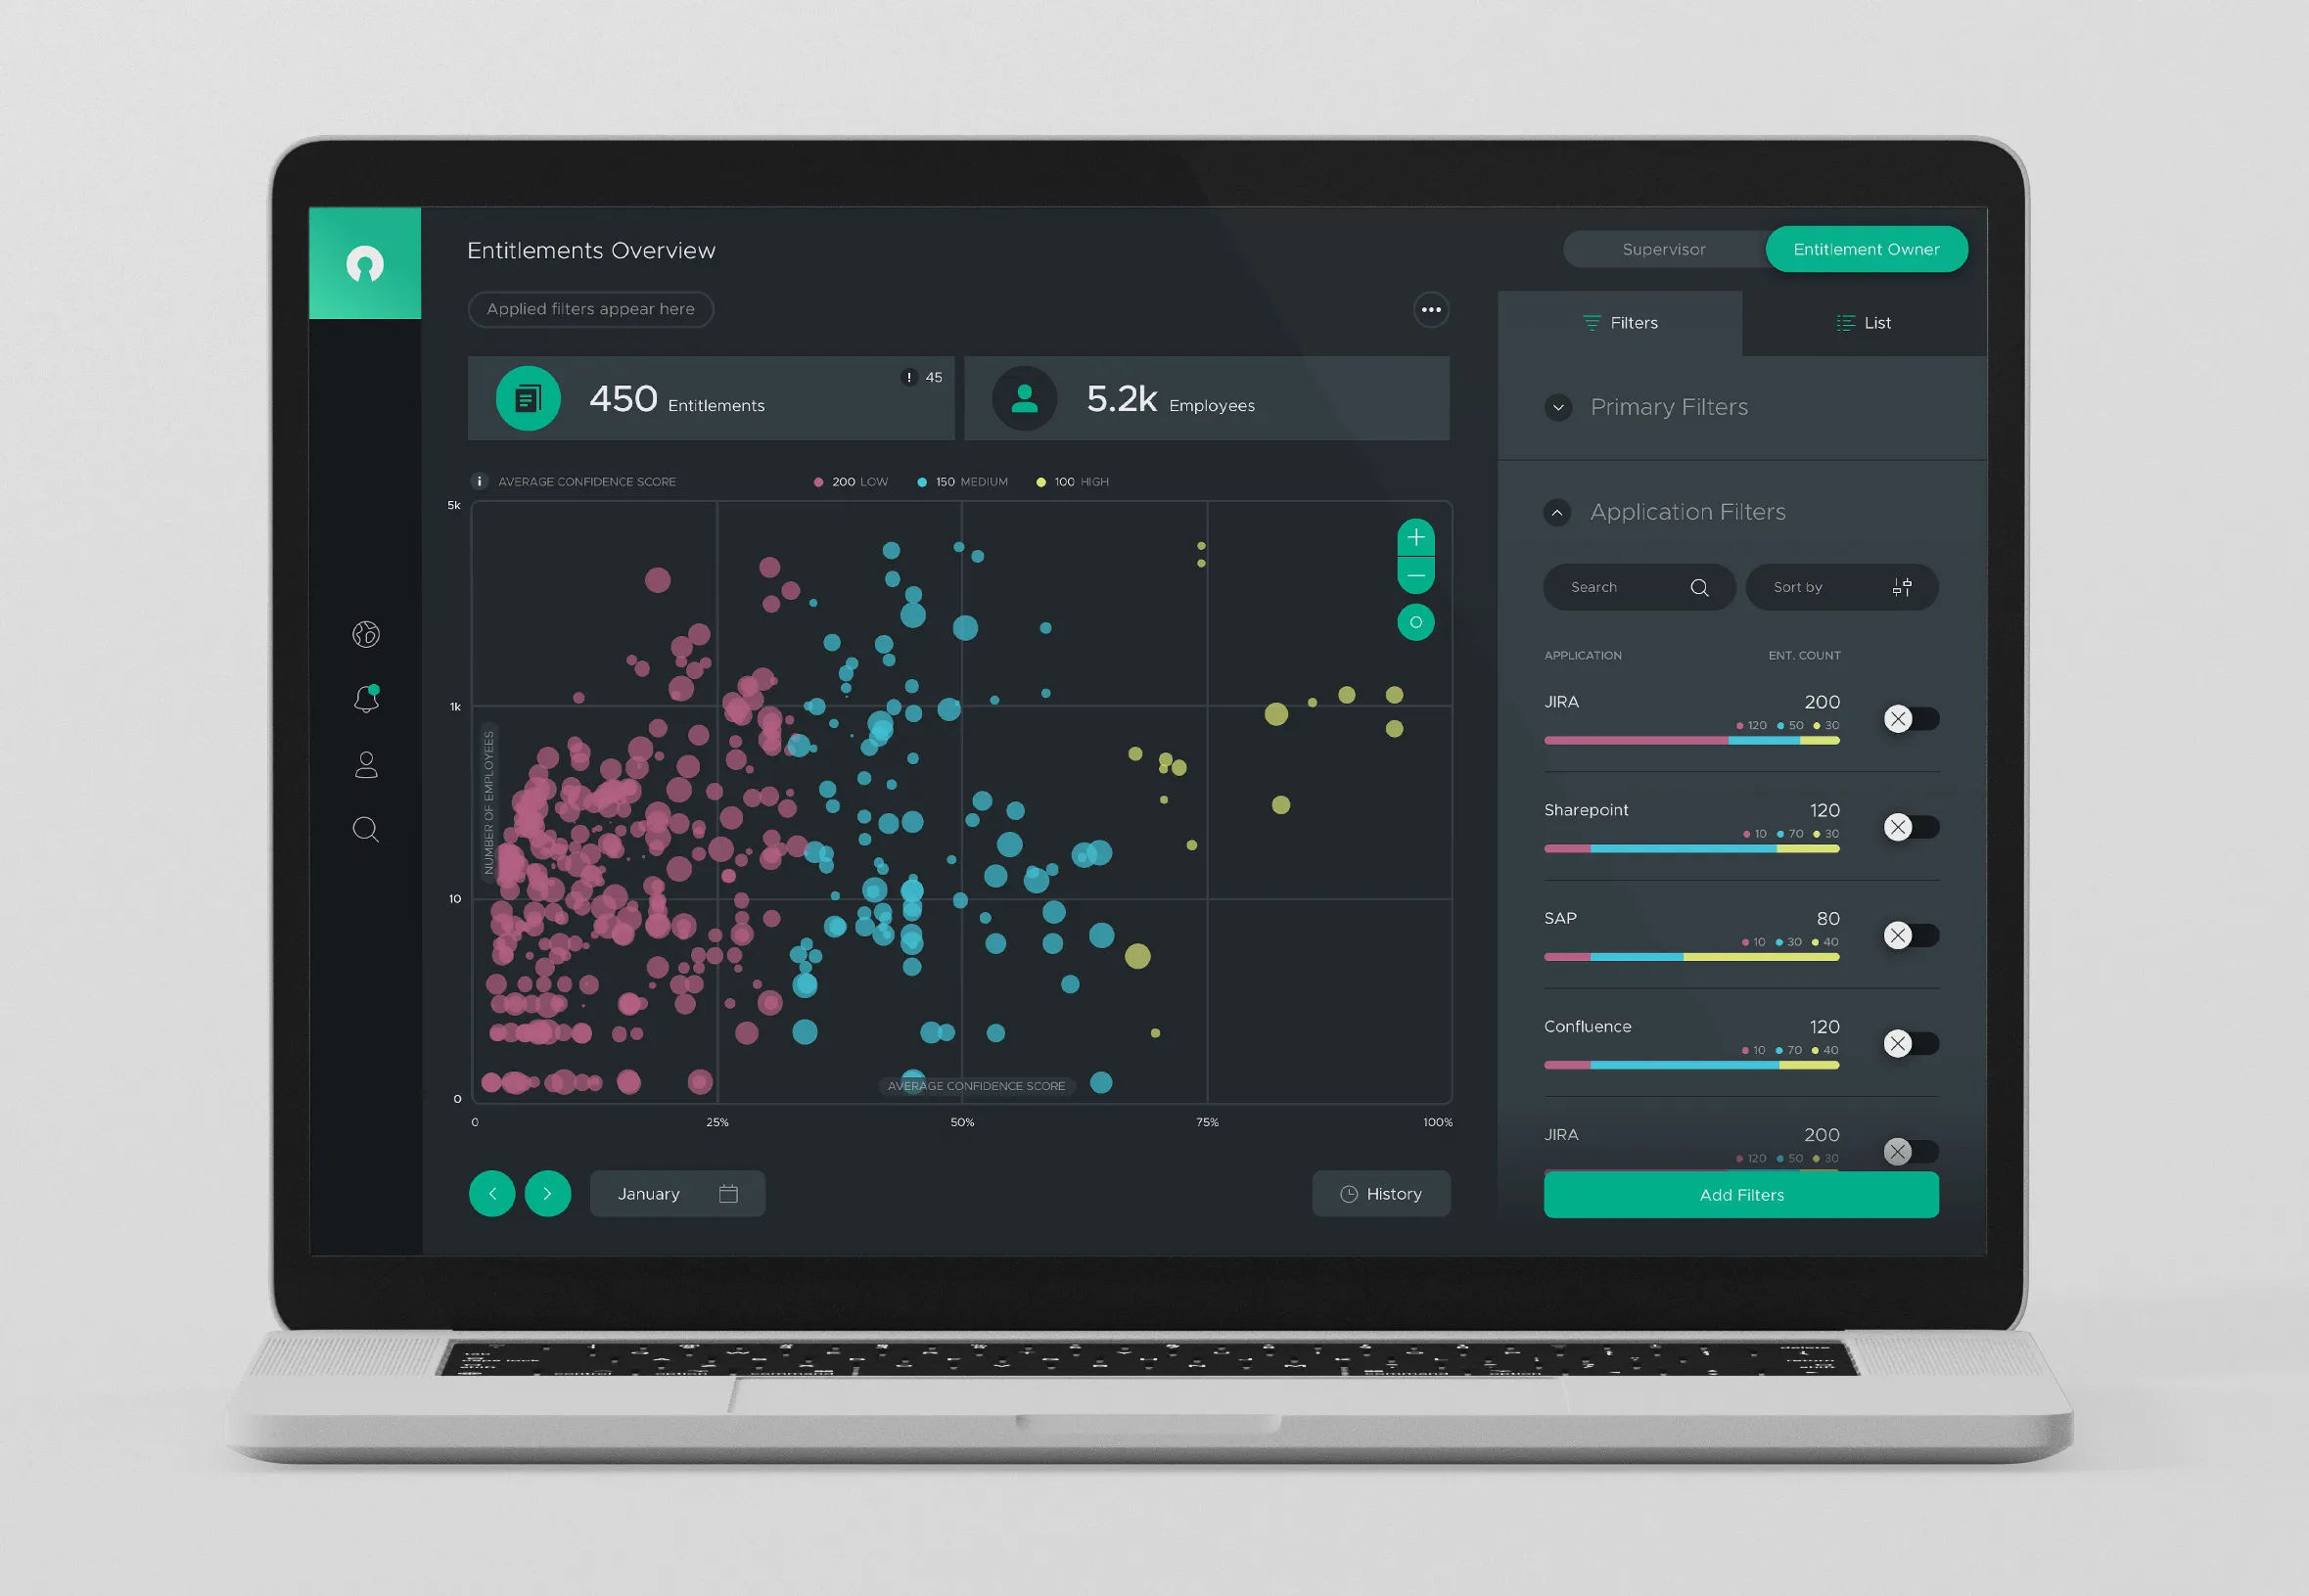
Entitlements overview
The overview plots every entitlement by its average confidence score and the number of employees who hold it. Colour groups entitlements into low, medium, and high confidence, so the riskiest clusters stand out. Filters narrow the view by application, risk, review date, or segregation-of-duty conflicts.

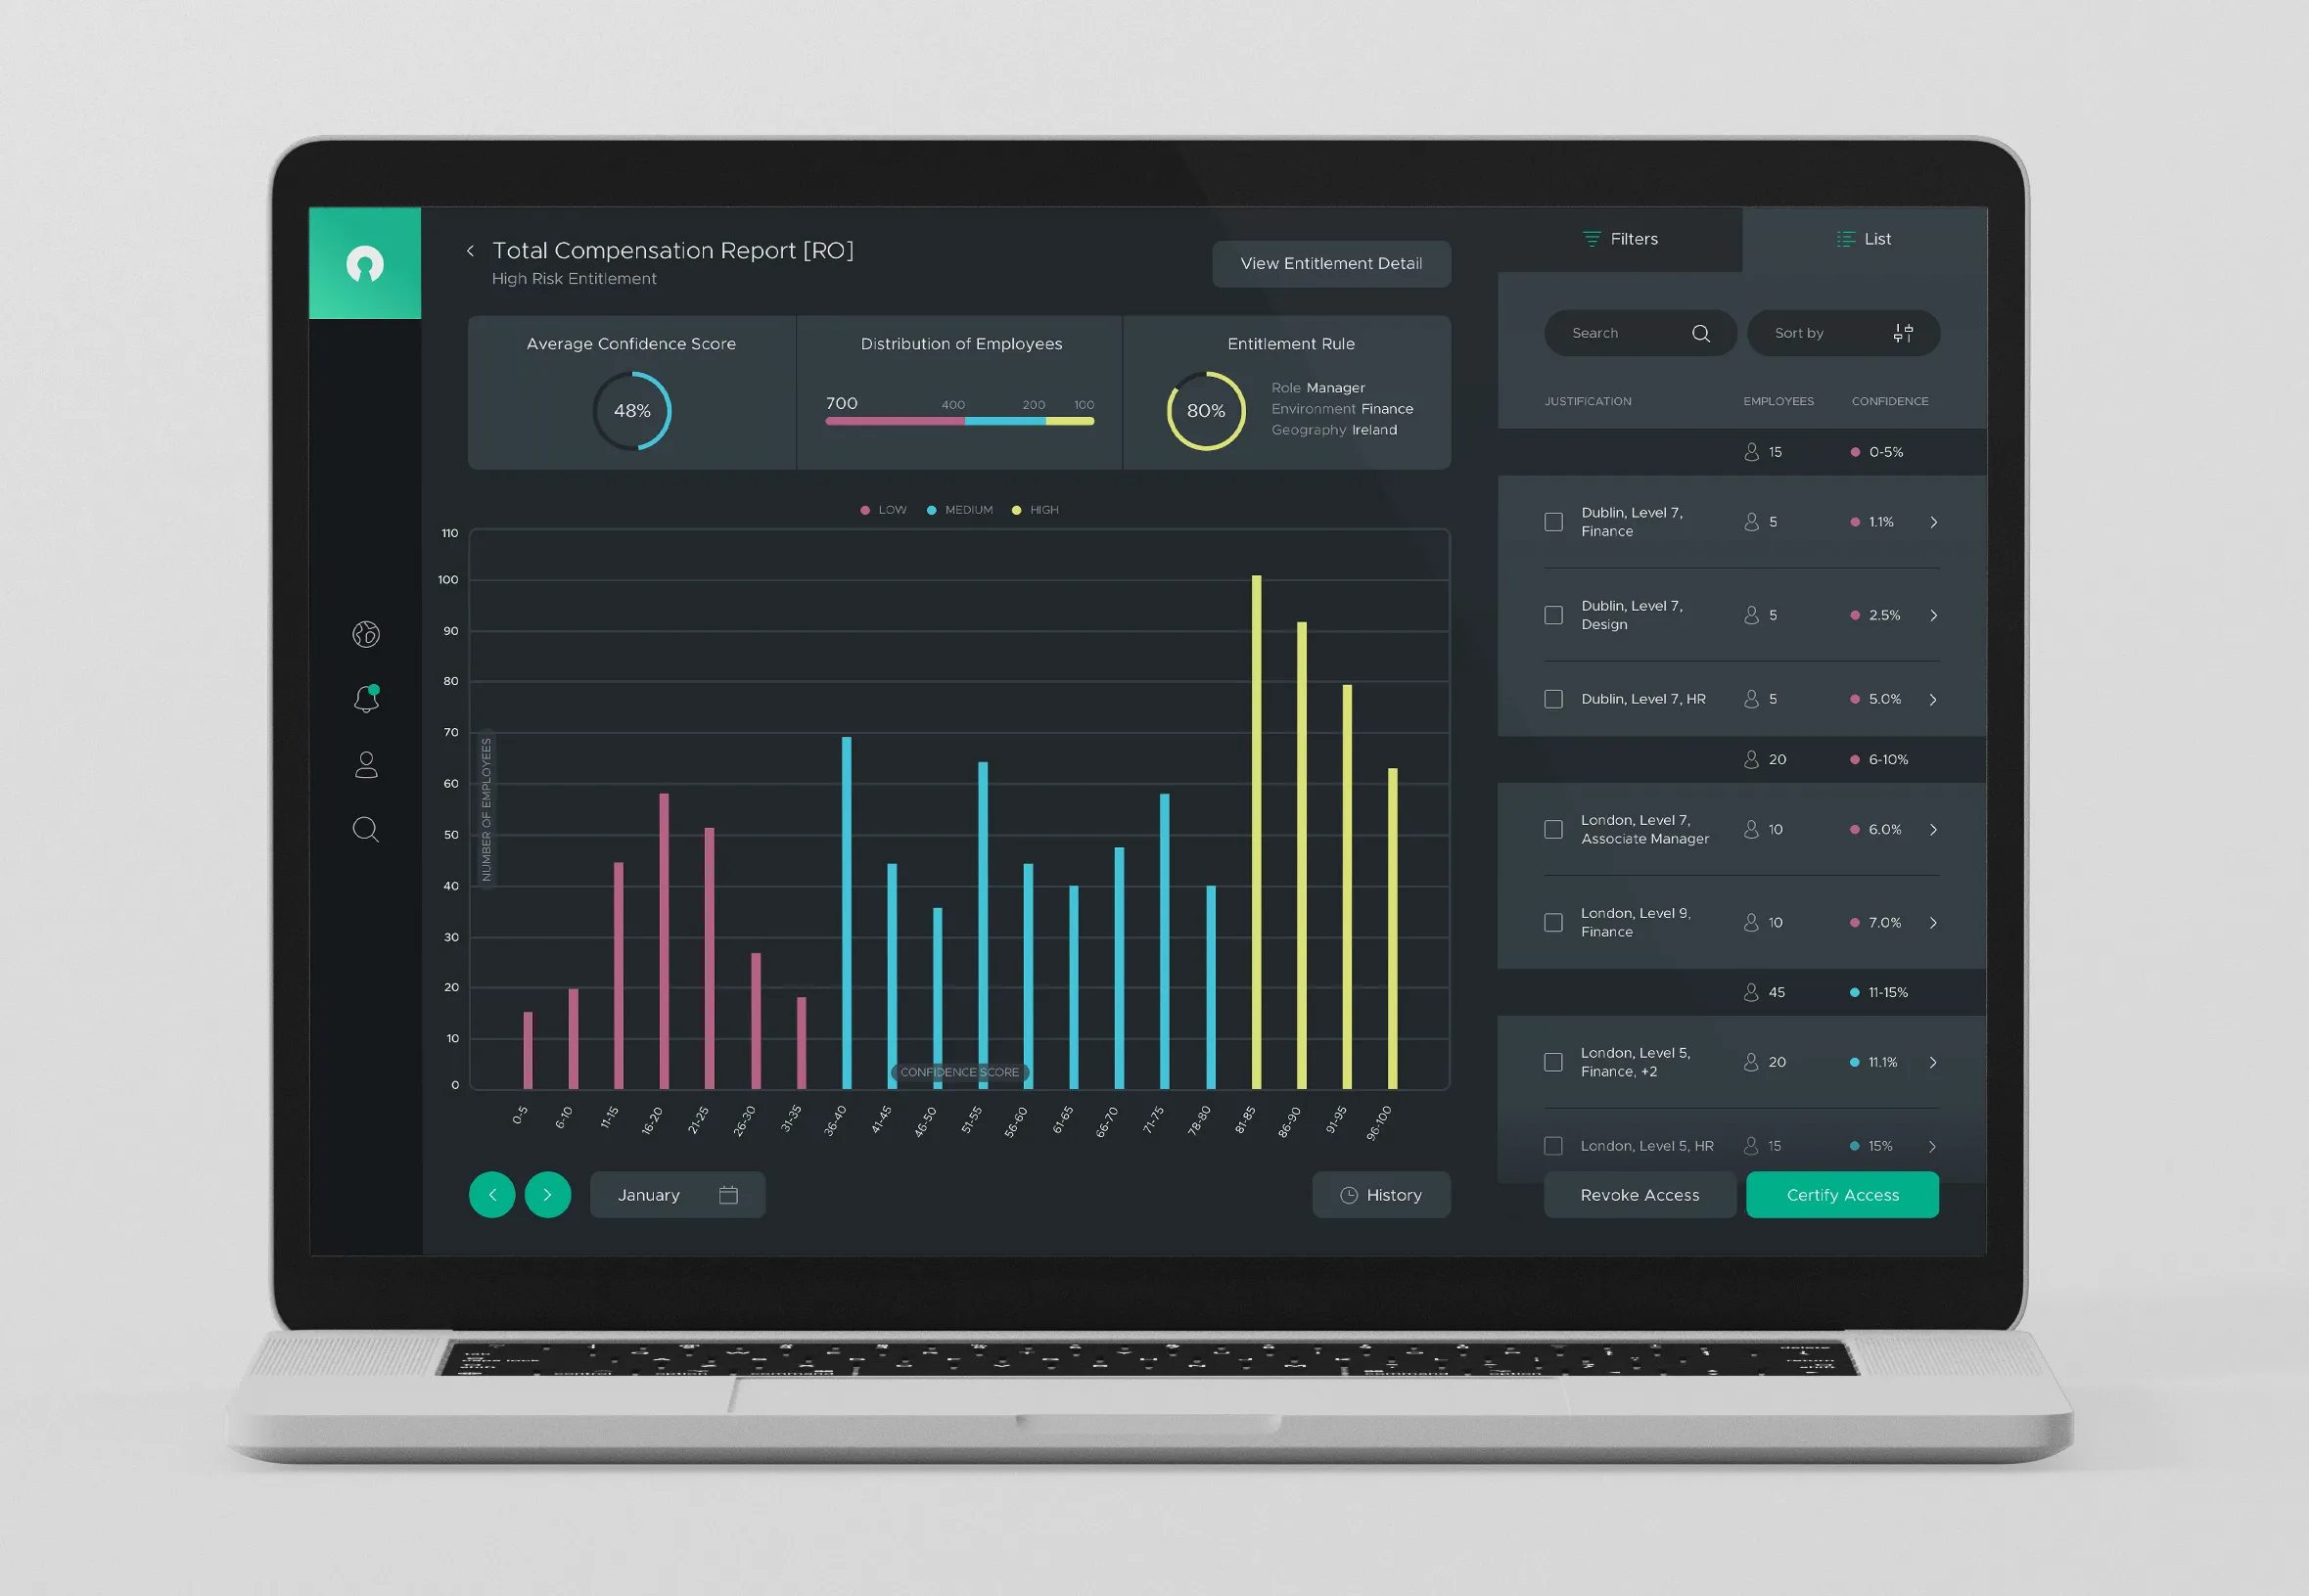
Entitlement detail
Selecting an entitlement shows how confidence is spread across the people who hold it, alongside the rule that grants it. A list groups holders by location, level, and department so reviewers can certify or revoke access in batches.


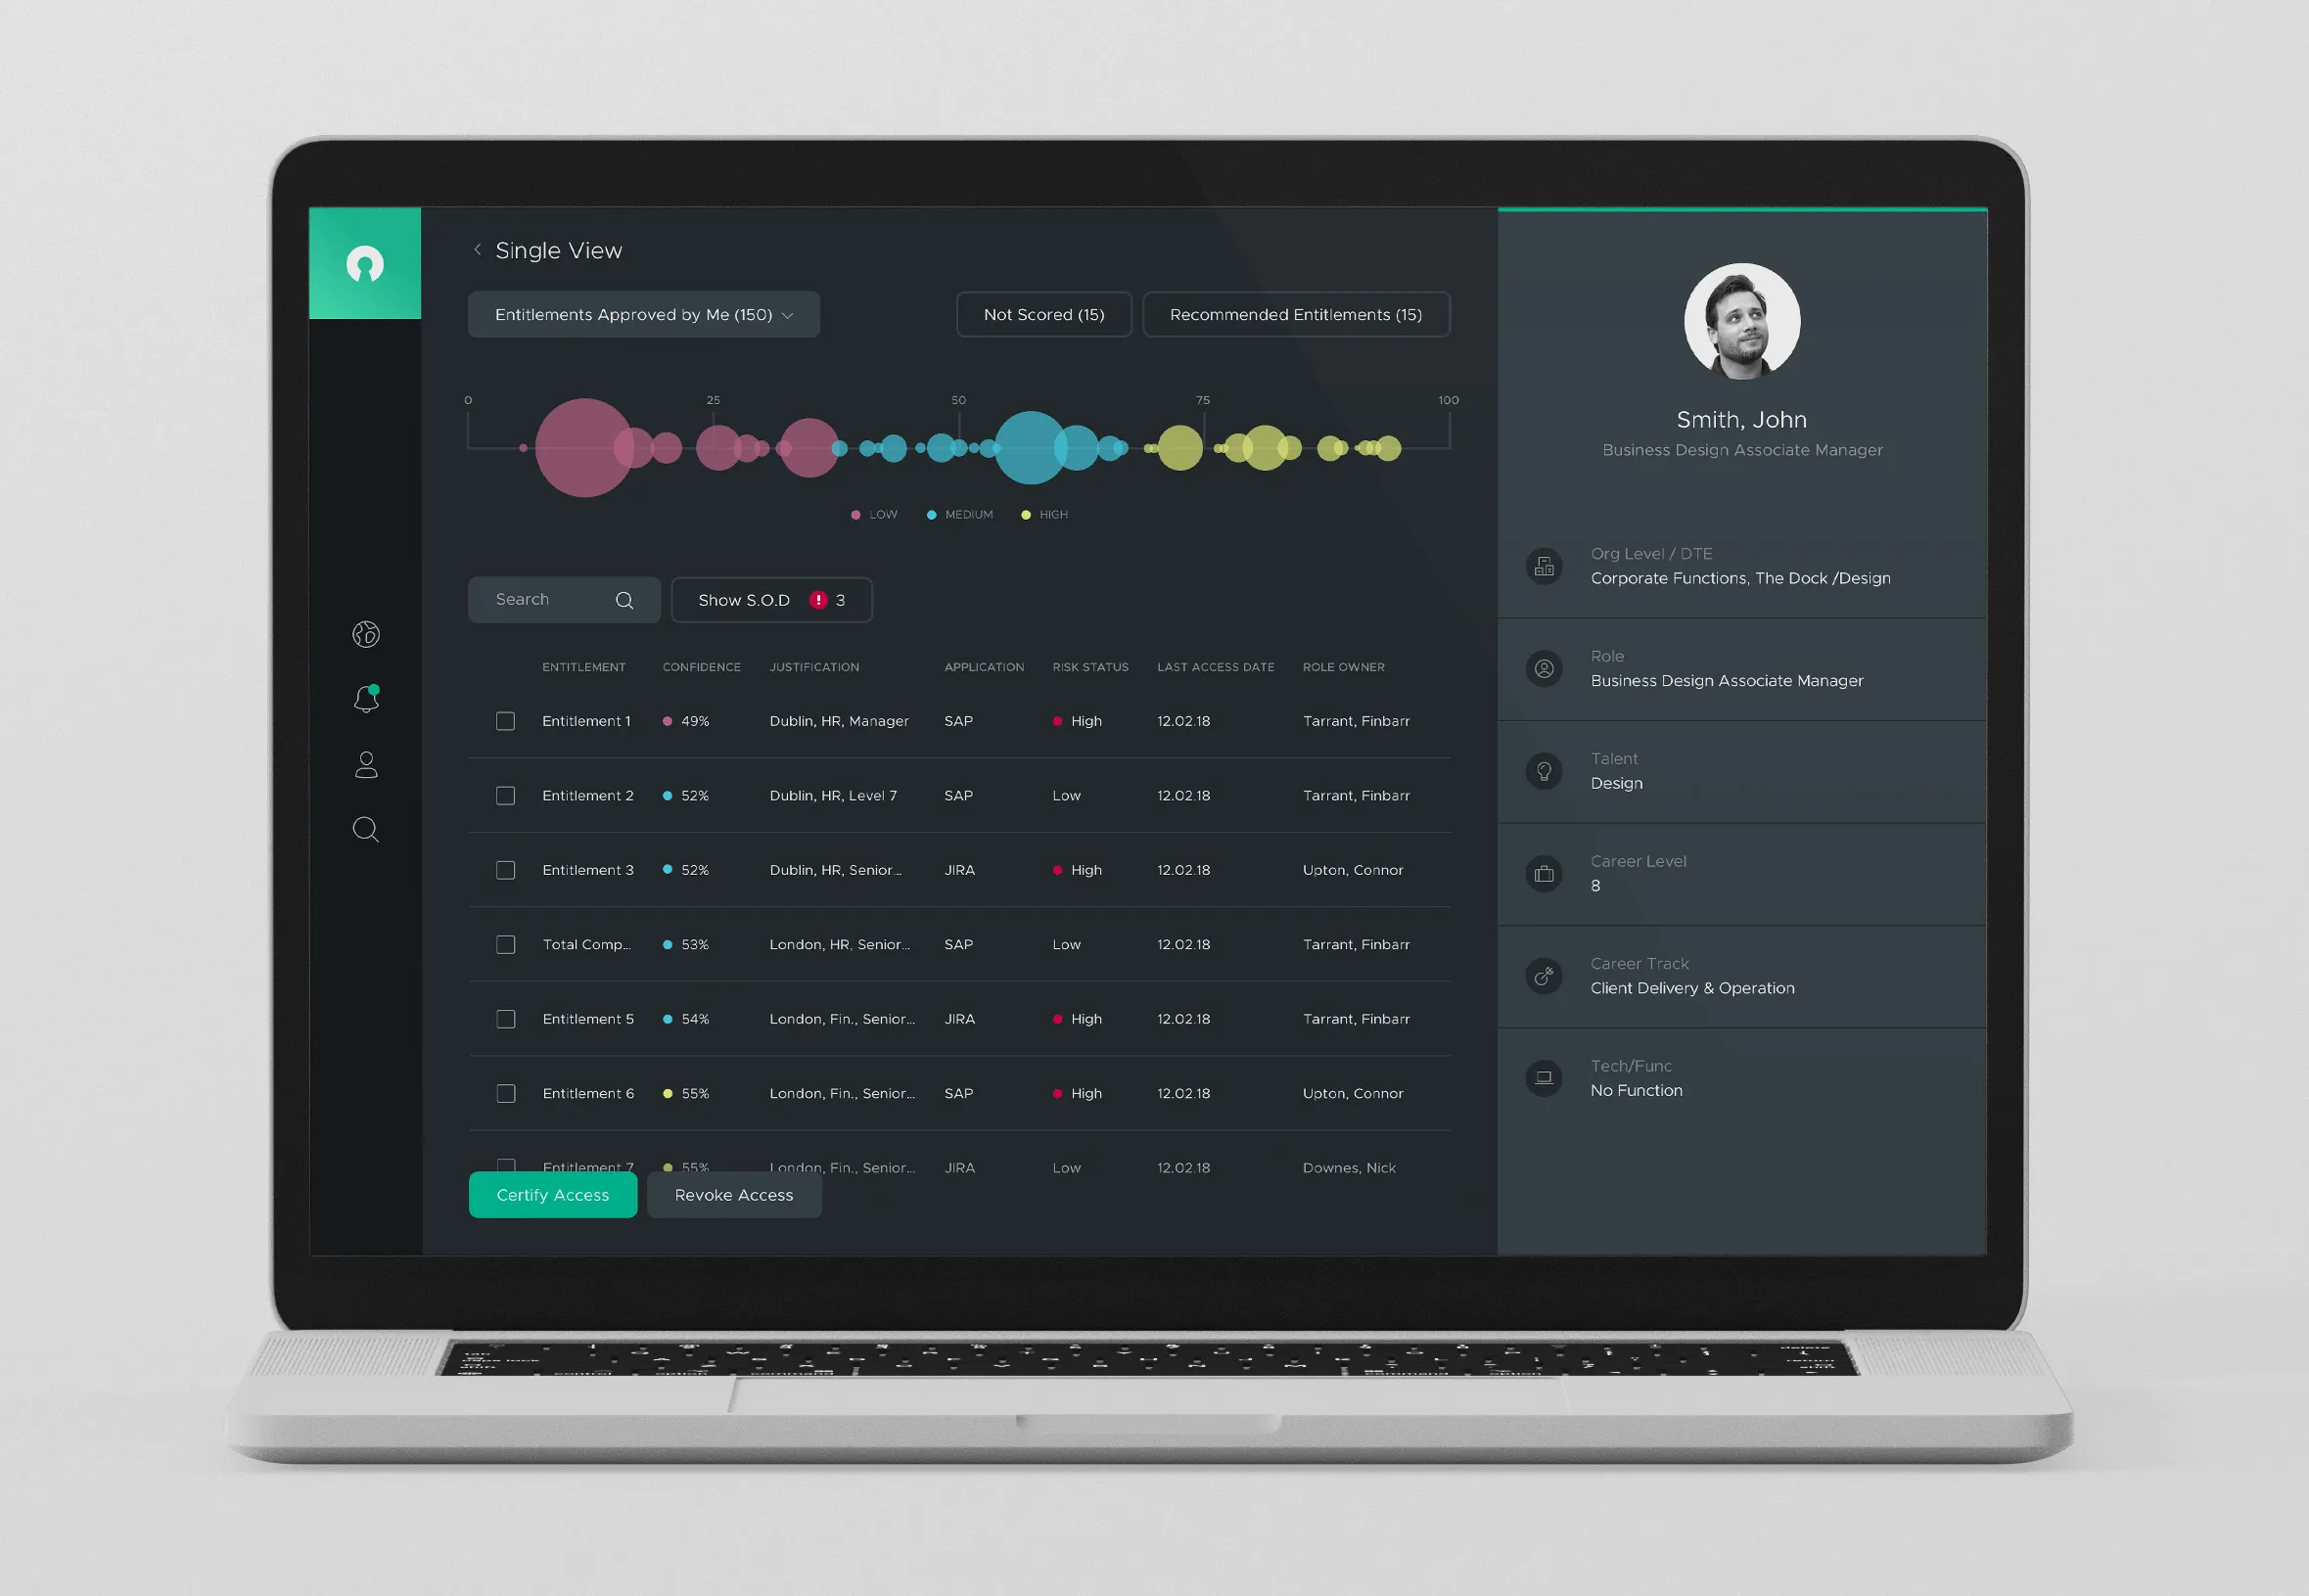
Single view
The single view turns the question around to show everything one person can access. A timeline places each entitlement by confidence, the table flags high-risk access and segregation-of-duty conflicts, and a profile panel gives the context a manager needs to decide.