Verizon Connect

05 / 12

Context
To be confirmed
Team
To be confirmed
Expertise
Product Design, B2B Platforms, Design Systems
Year
To be confirmed
Verizon Connect project

Overview

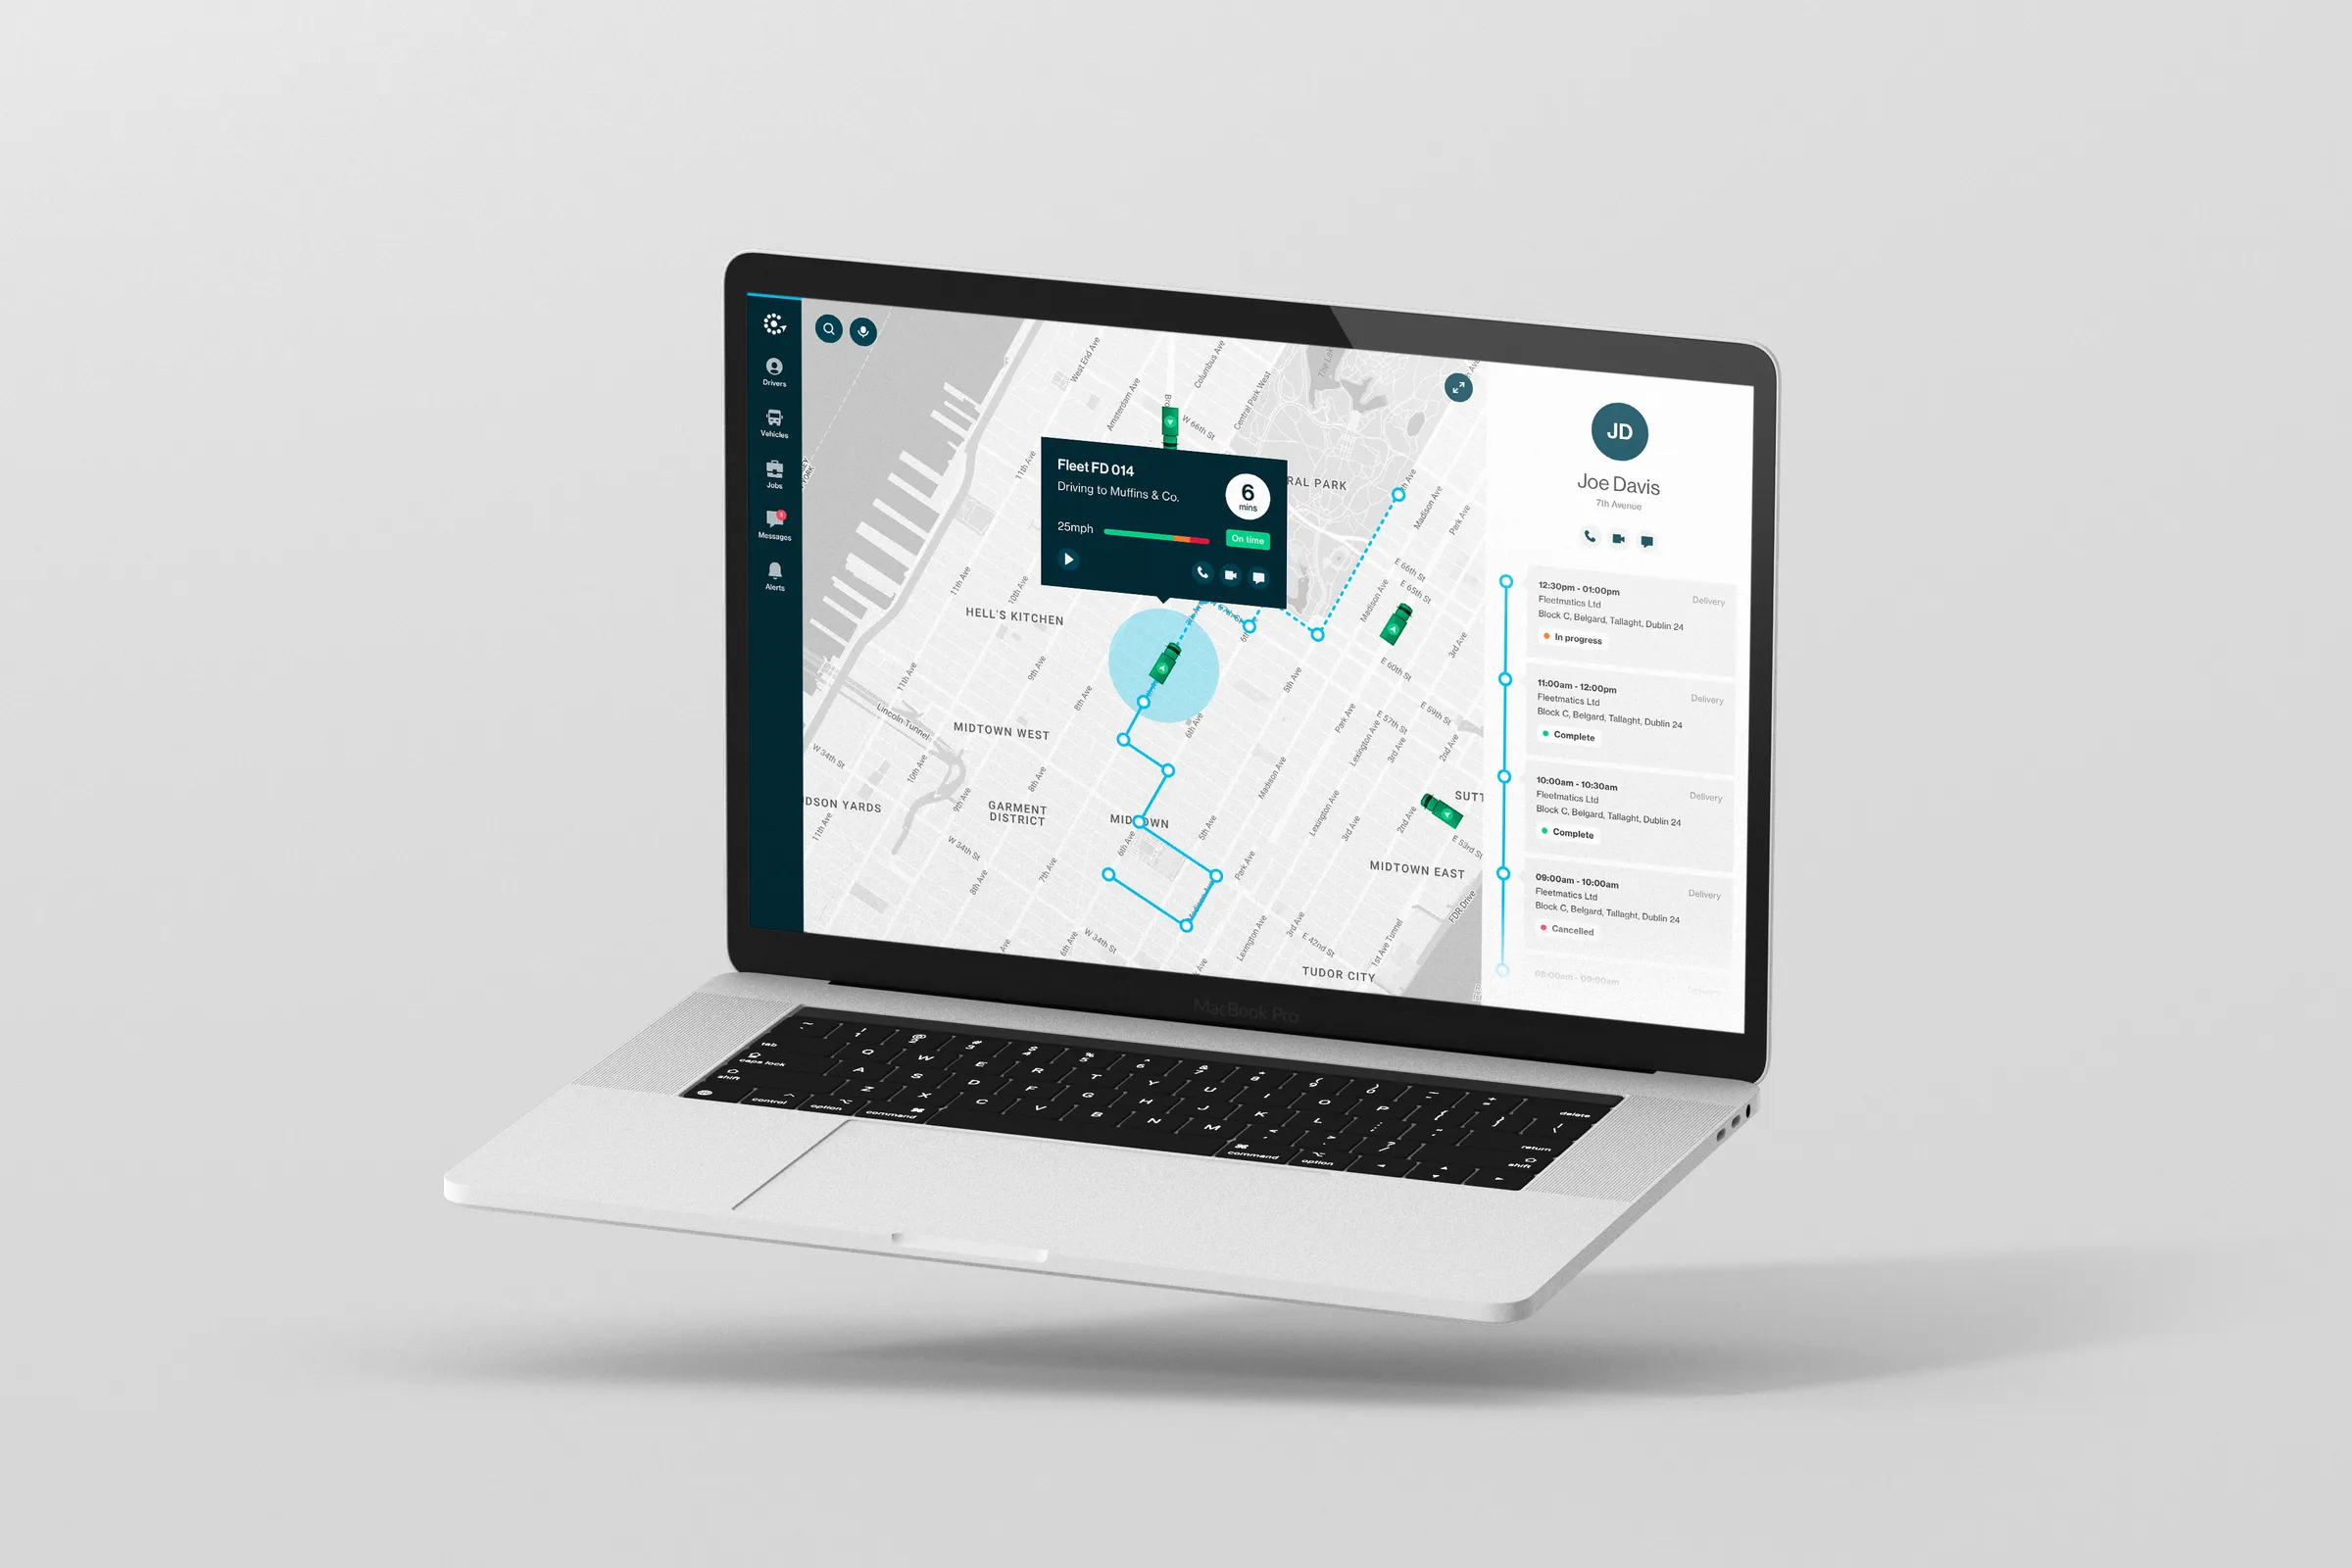
Verizon Connect, originally Fleetmatics, makes software that helps businesses track and manage their vehicles, drivers, and jobs. Fleet managers rely on it to answer simple questions quickly: where is everyone, what are they working on, and is anything going wrong? Over time the product had grown into dense reports and screens that made those answers harder to reach.

This project explored a clearer way to see a fleet. Starting from team workshops and whiteboard sessions, the work brought the live map, driver activity, and alerts together on desktop and mobile, and extended the same visual language to a tablet logbook that drivers use to record their hours on the road.

Workshops

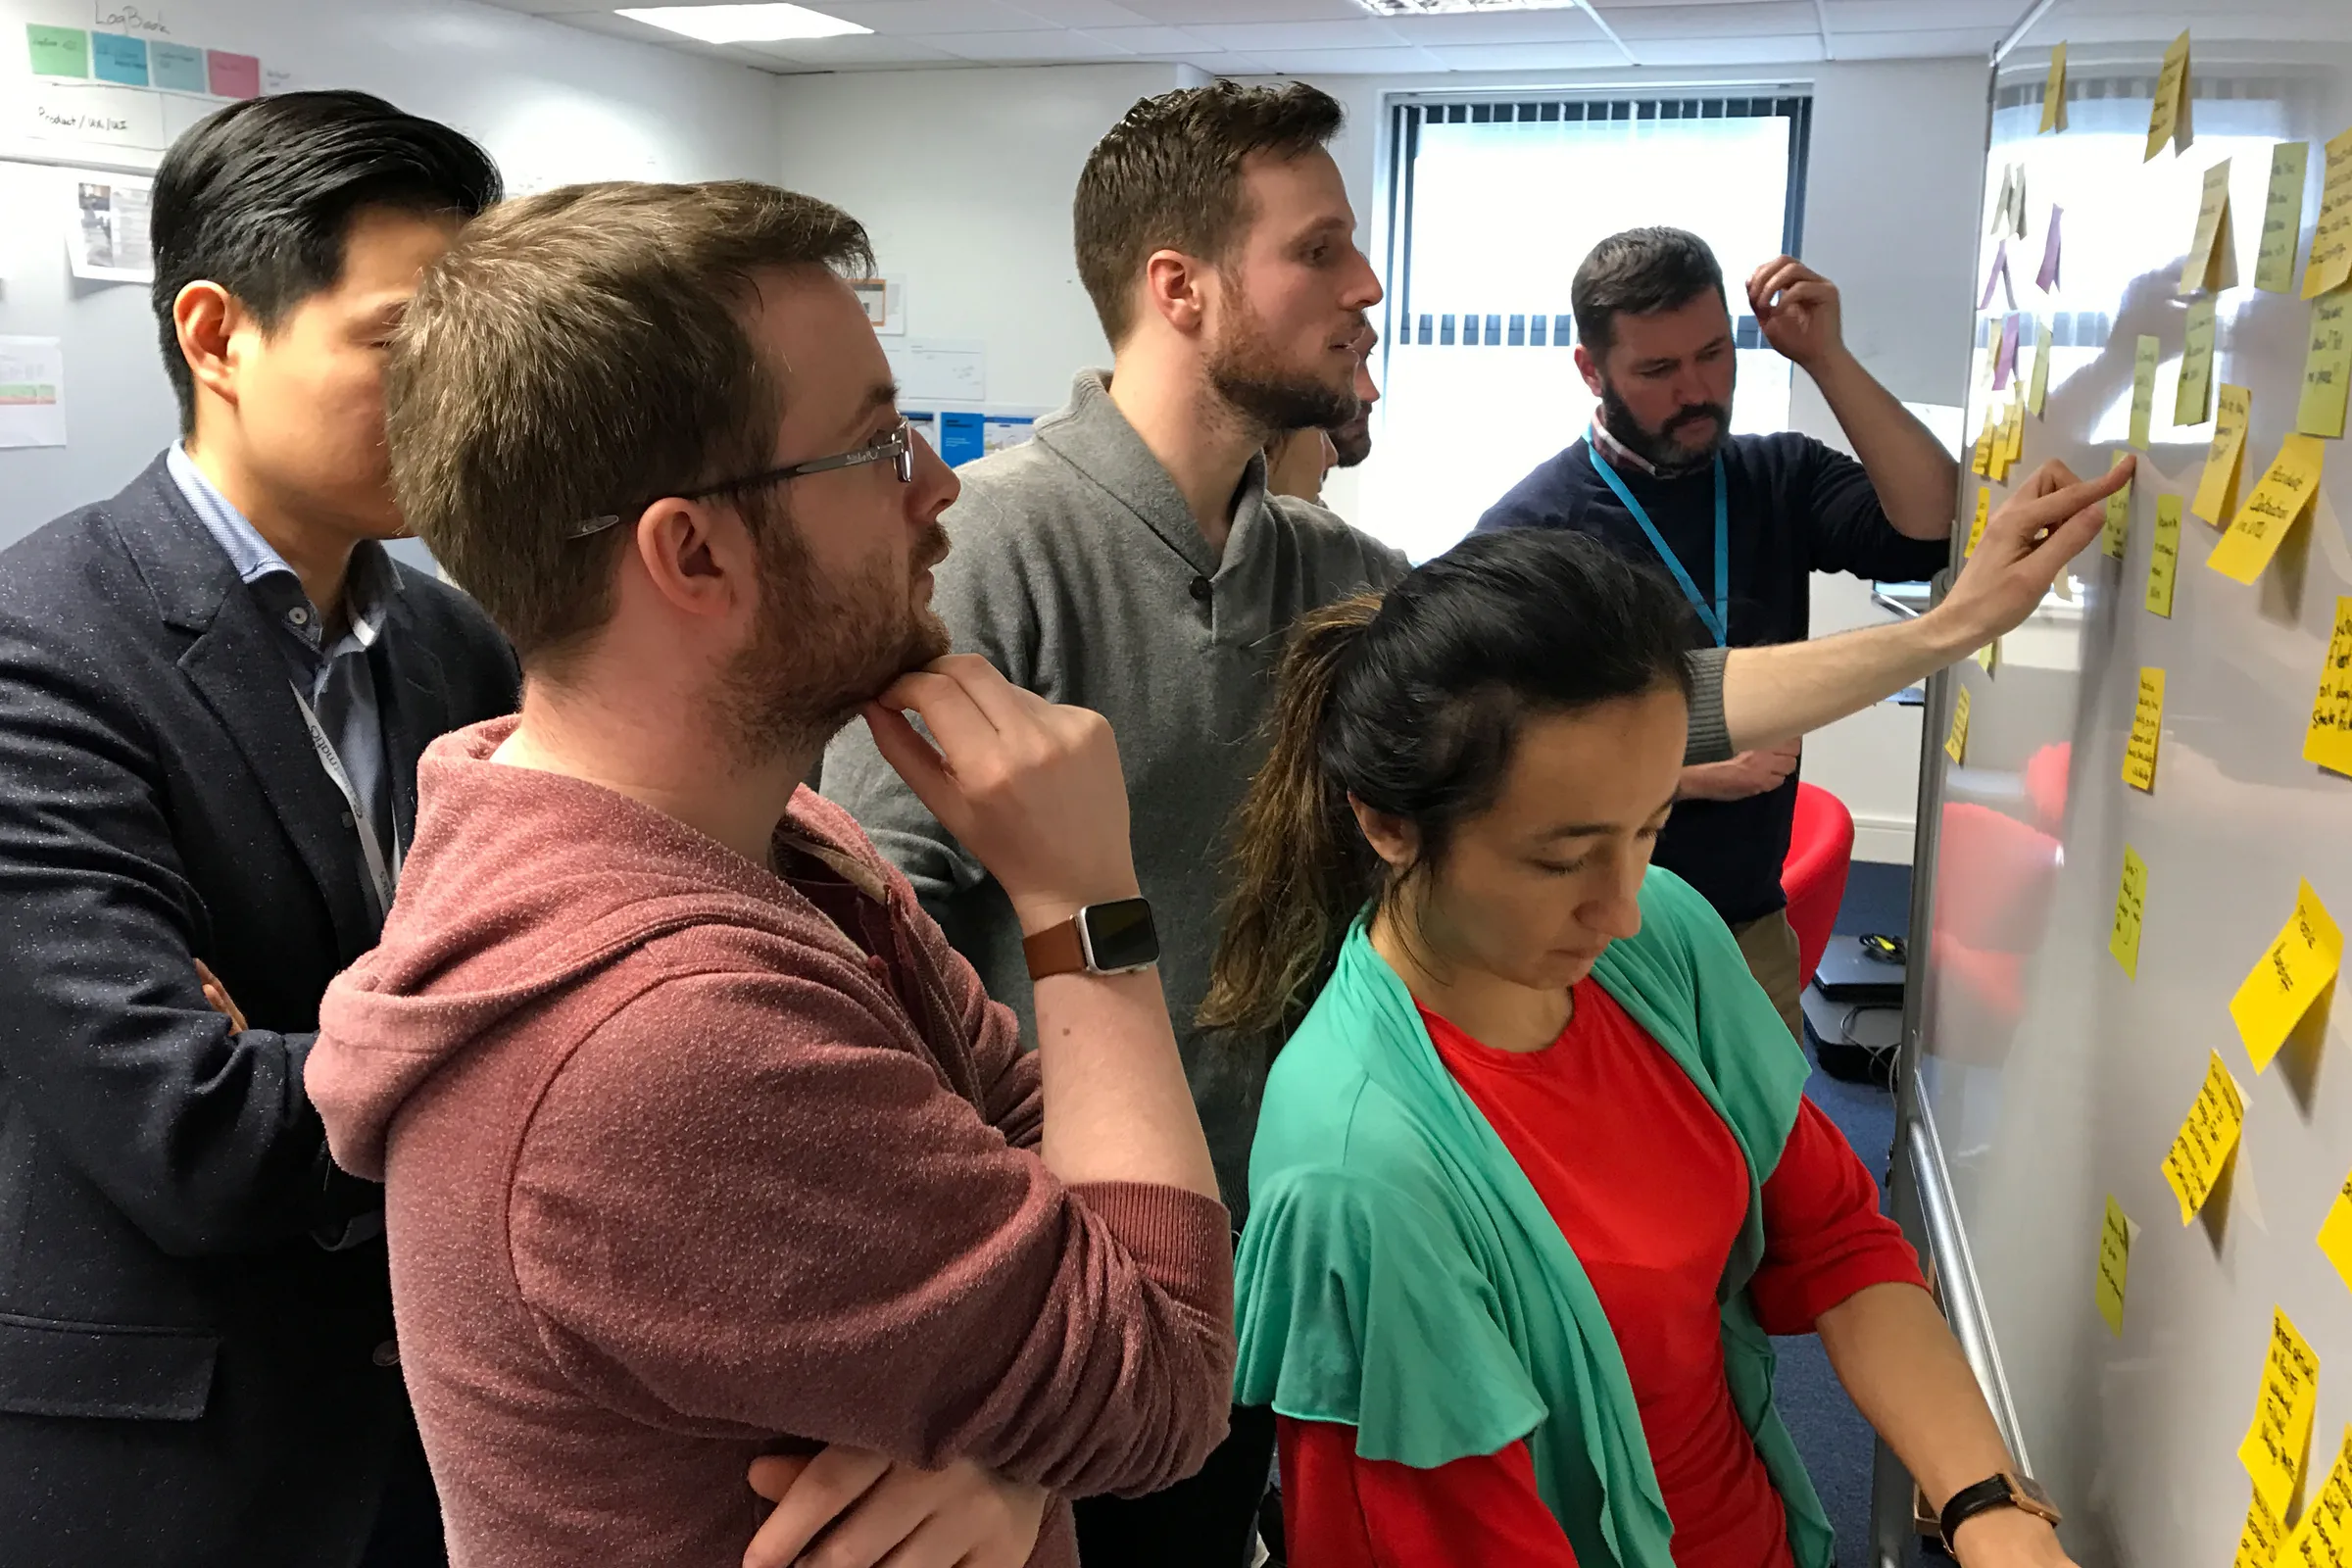
Workshops with product, engineering, and design gathered what fleet managers needed to know at a glance, then sorted those needs into groups that suggested how the product could be organised.
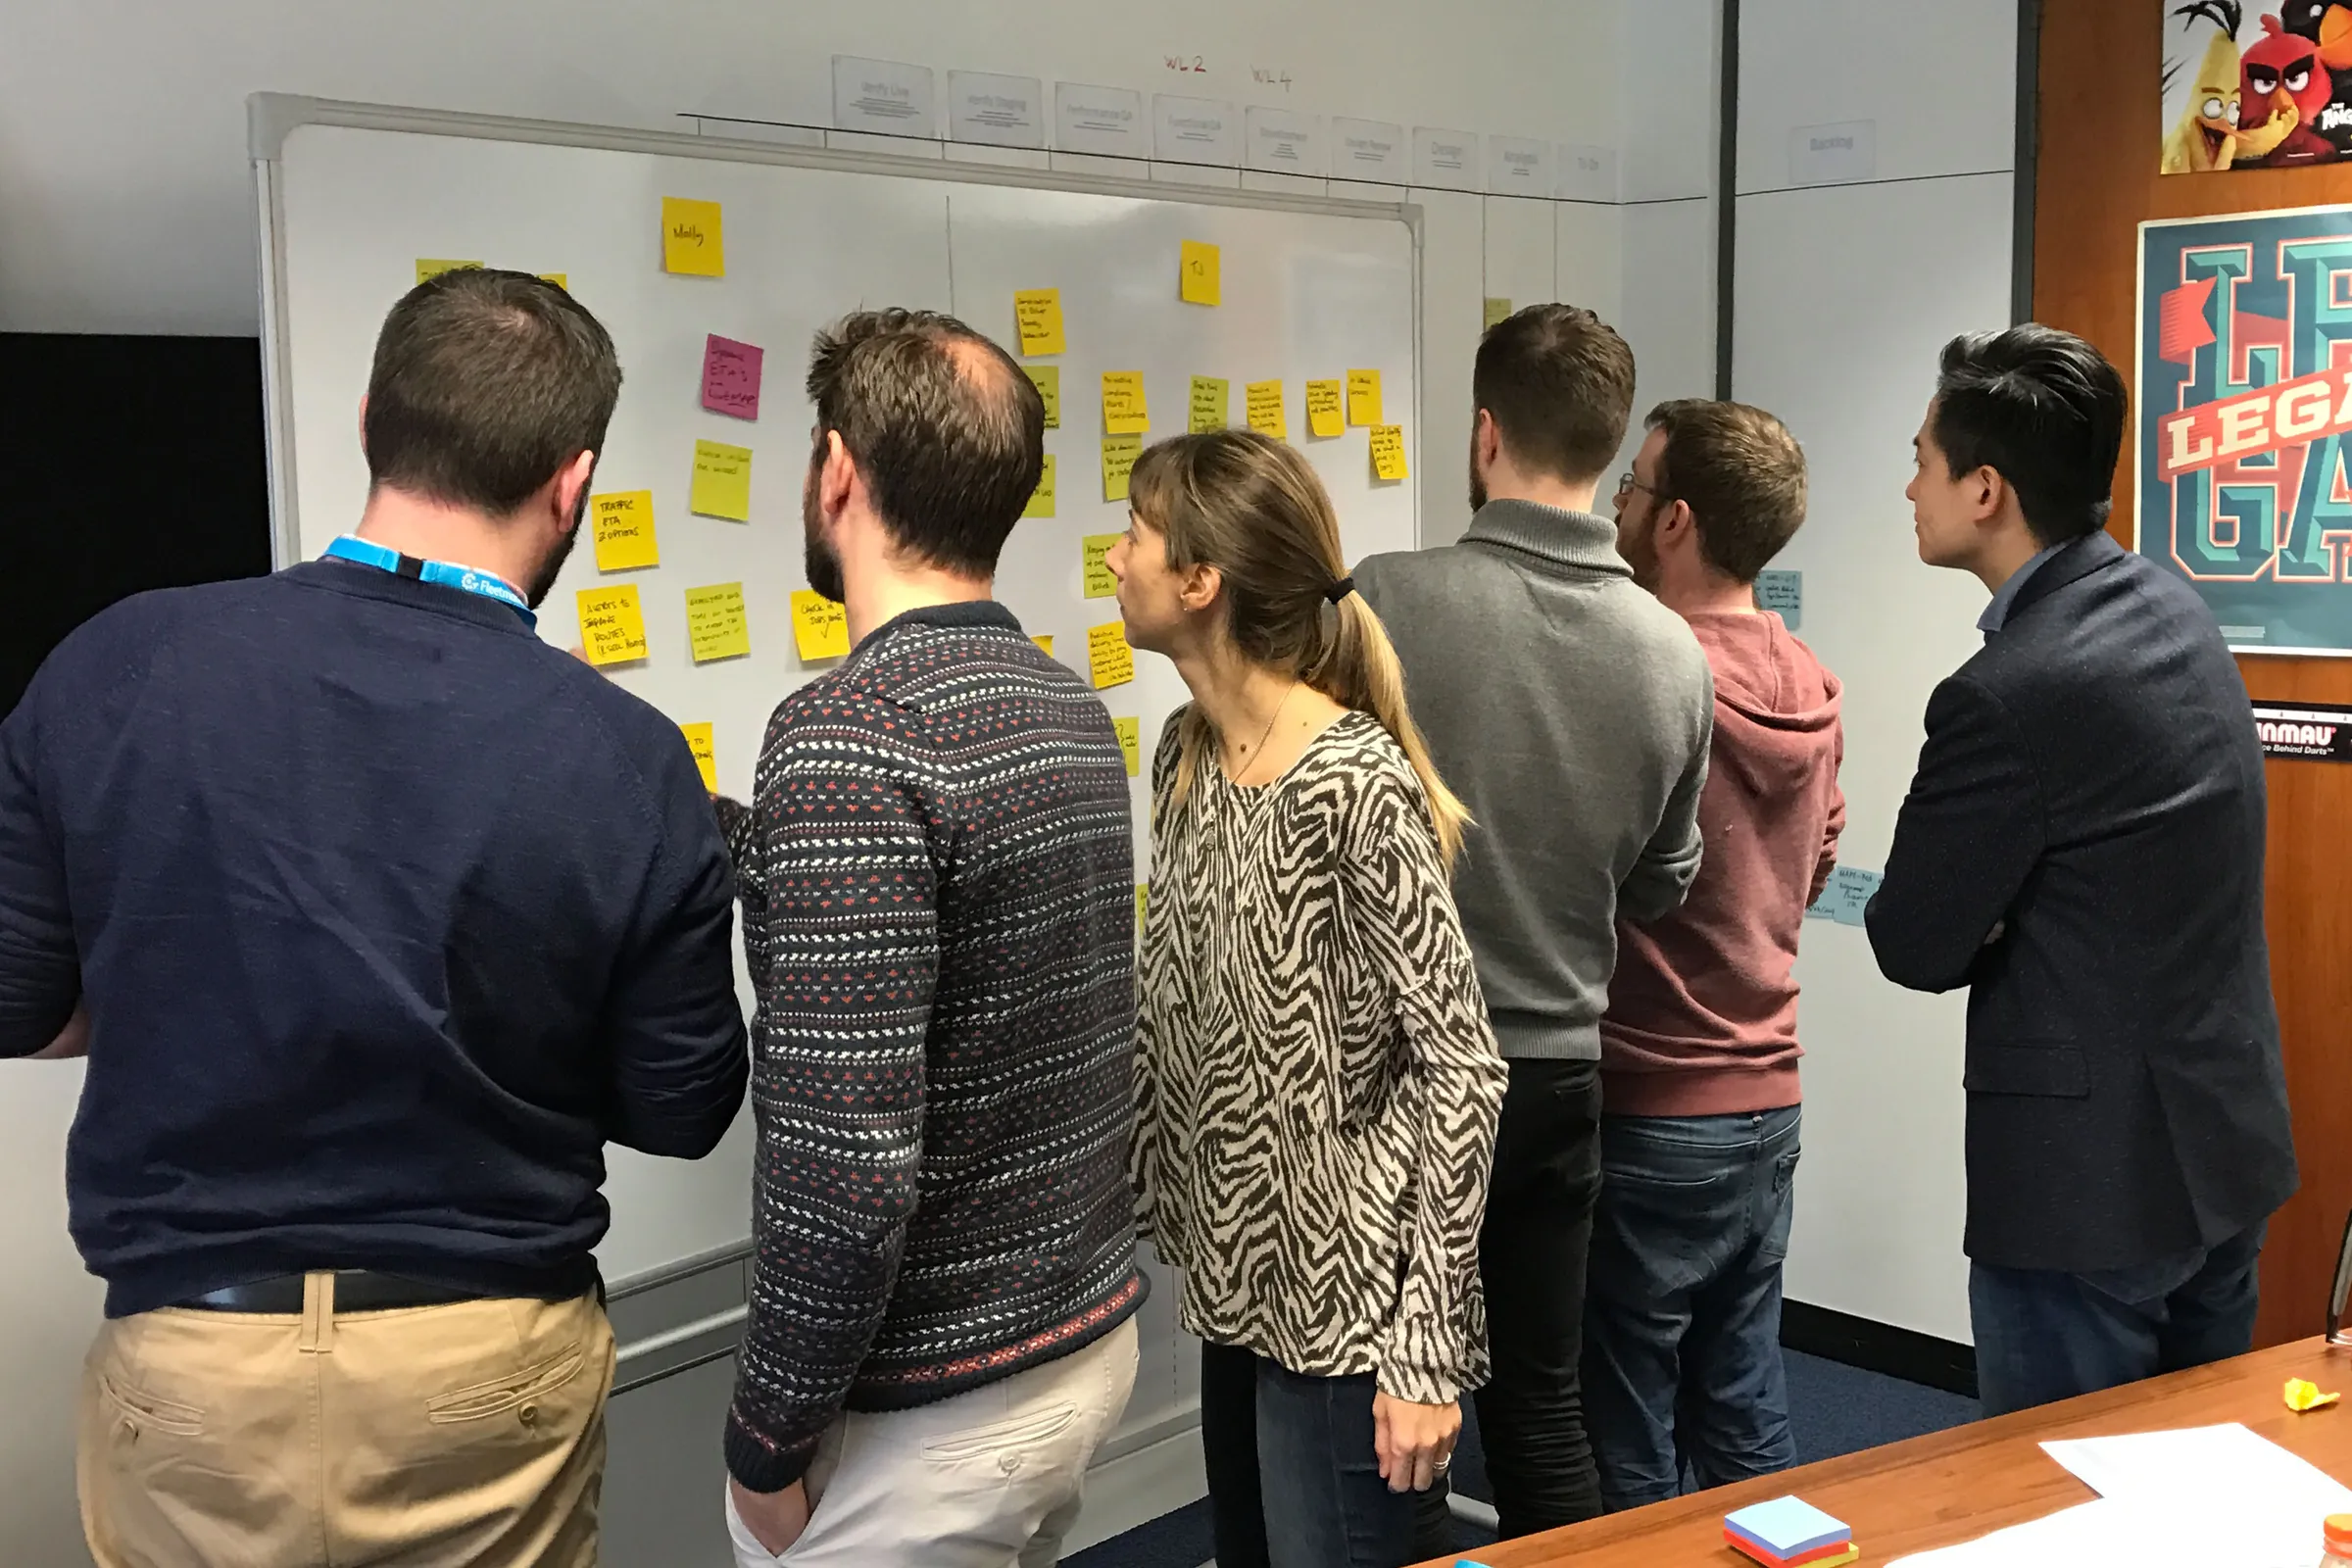
Six team members standing at a whiteboard covered in yellow sticky notes during a workshop
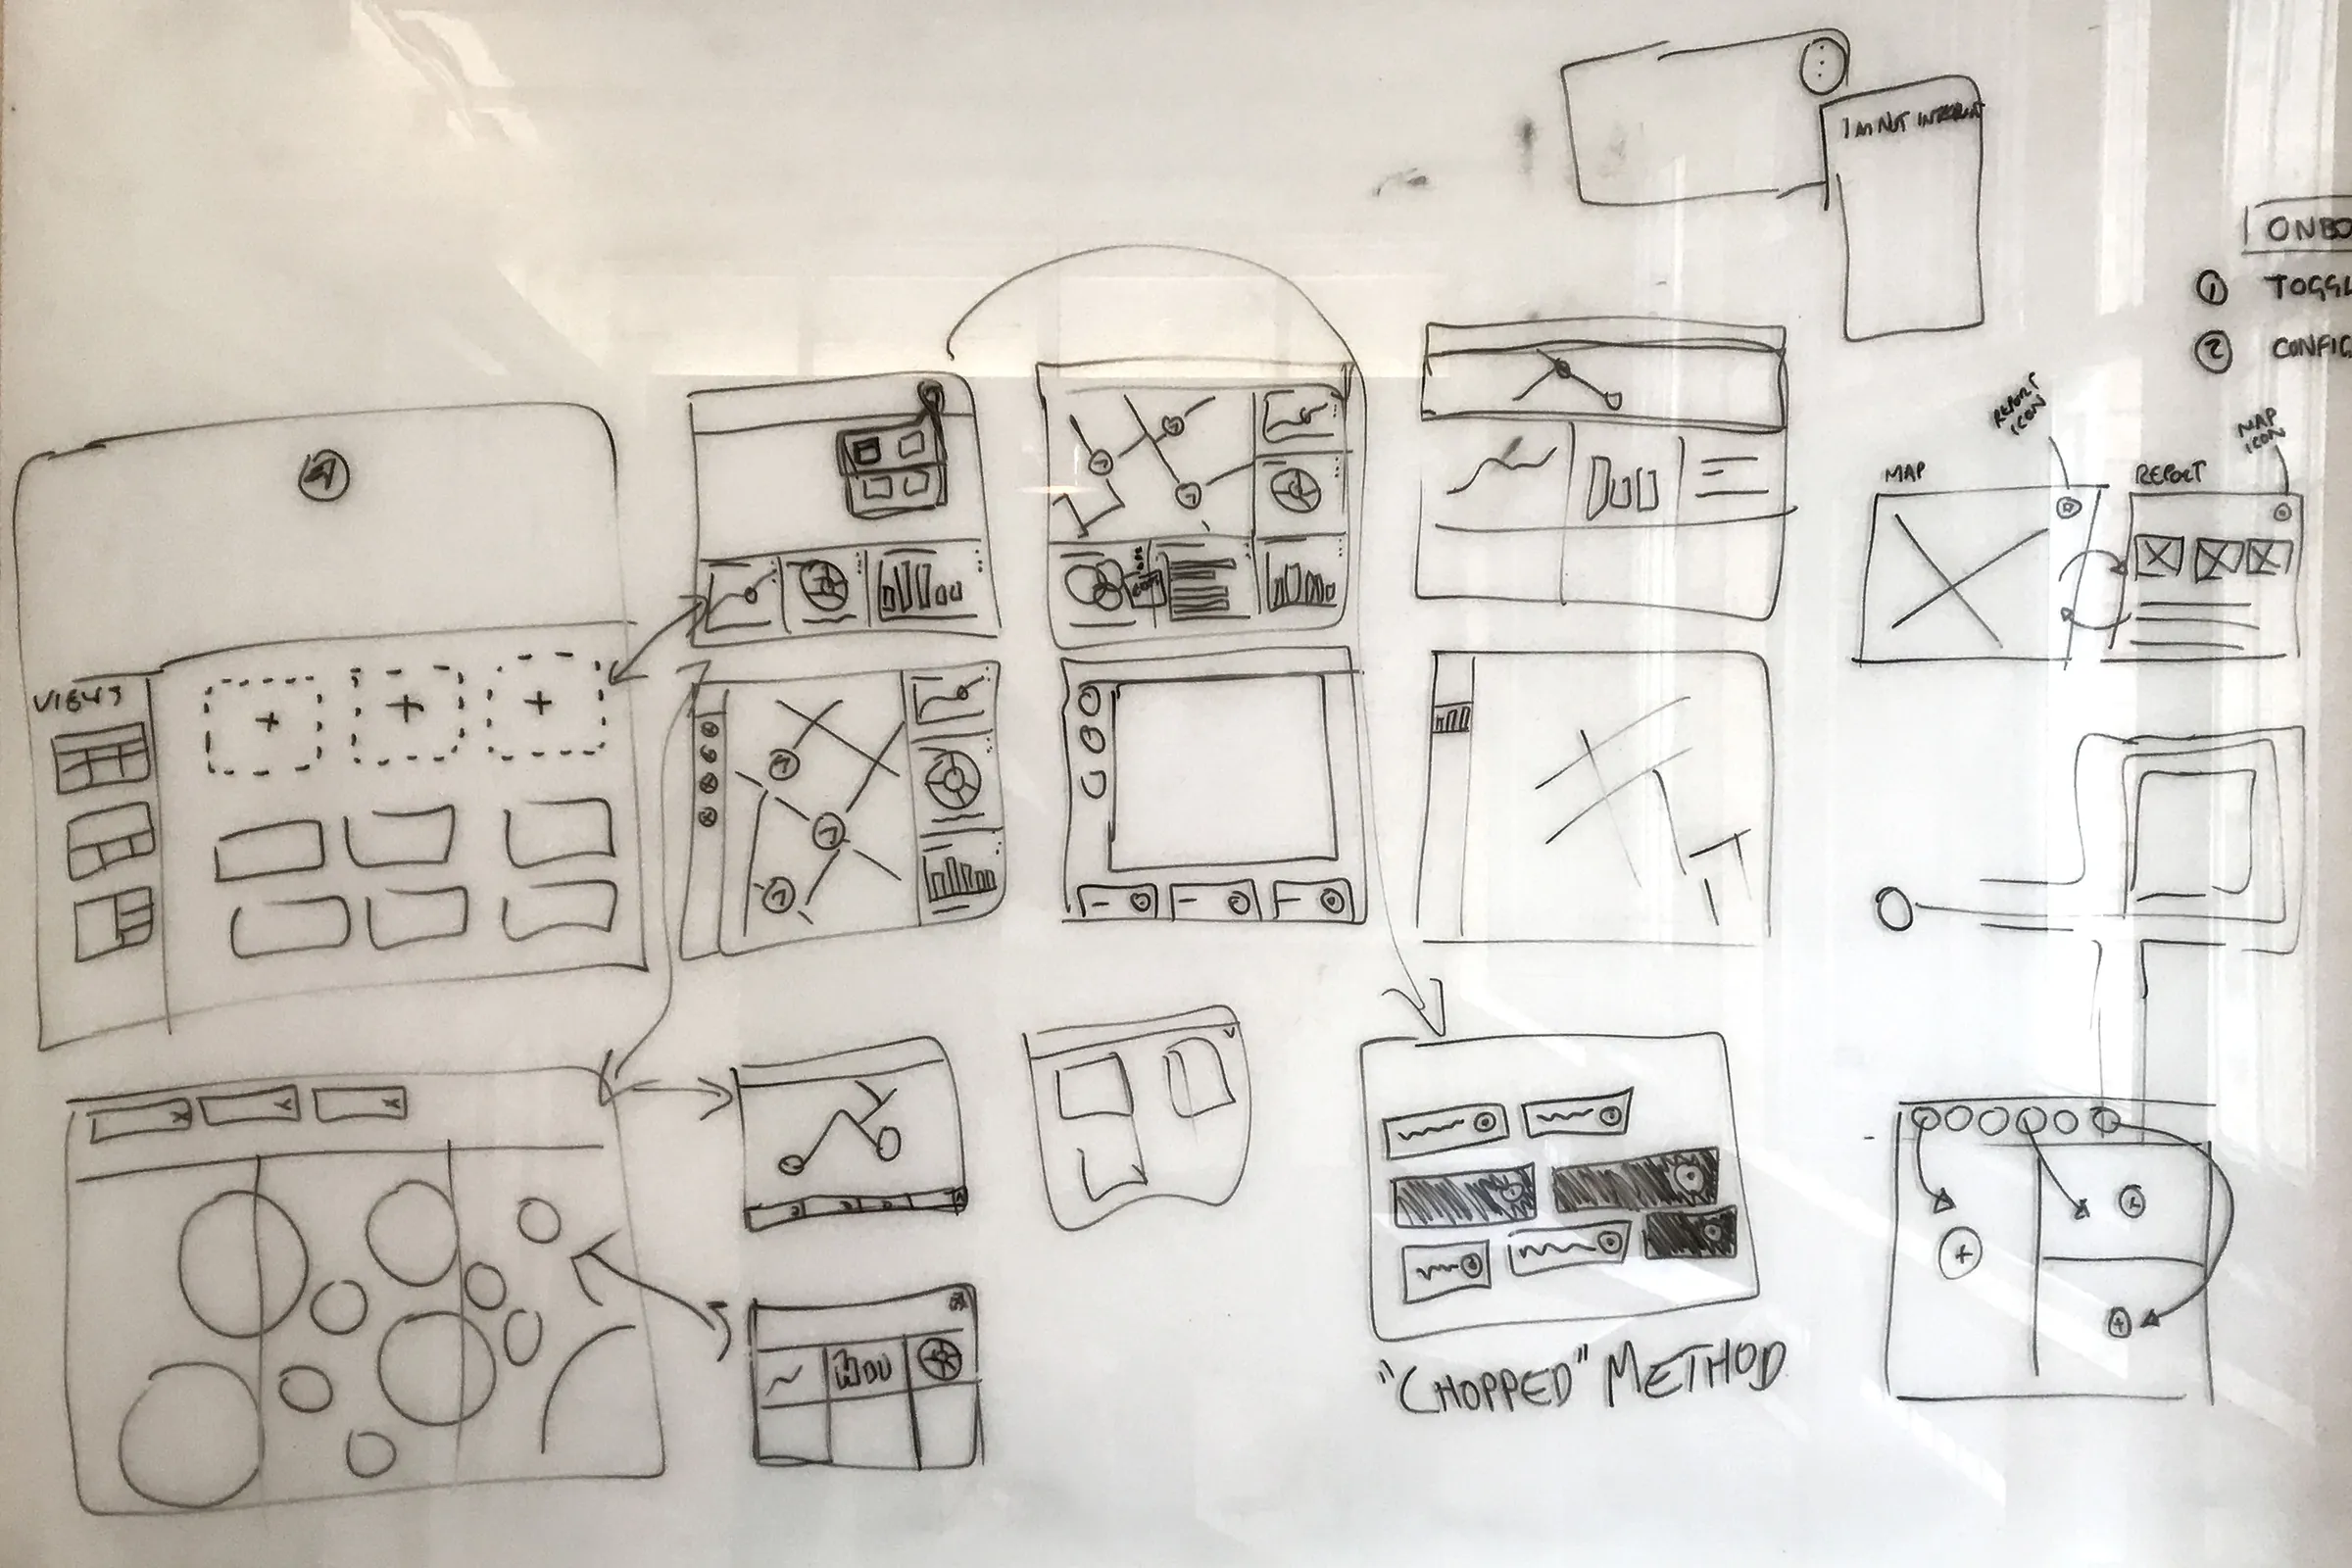
Team members discussing sticky notes on a whiteboard as one points to a cluster of ideasWhiteboard of interface sketches linking a customisable dashboard, map layouts, and a chopped card method

Sketching

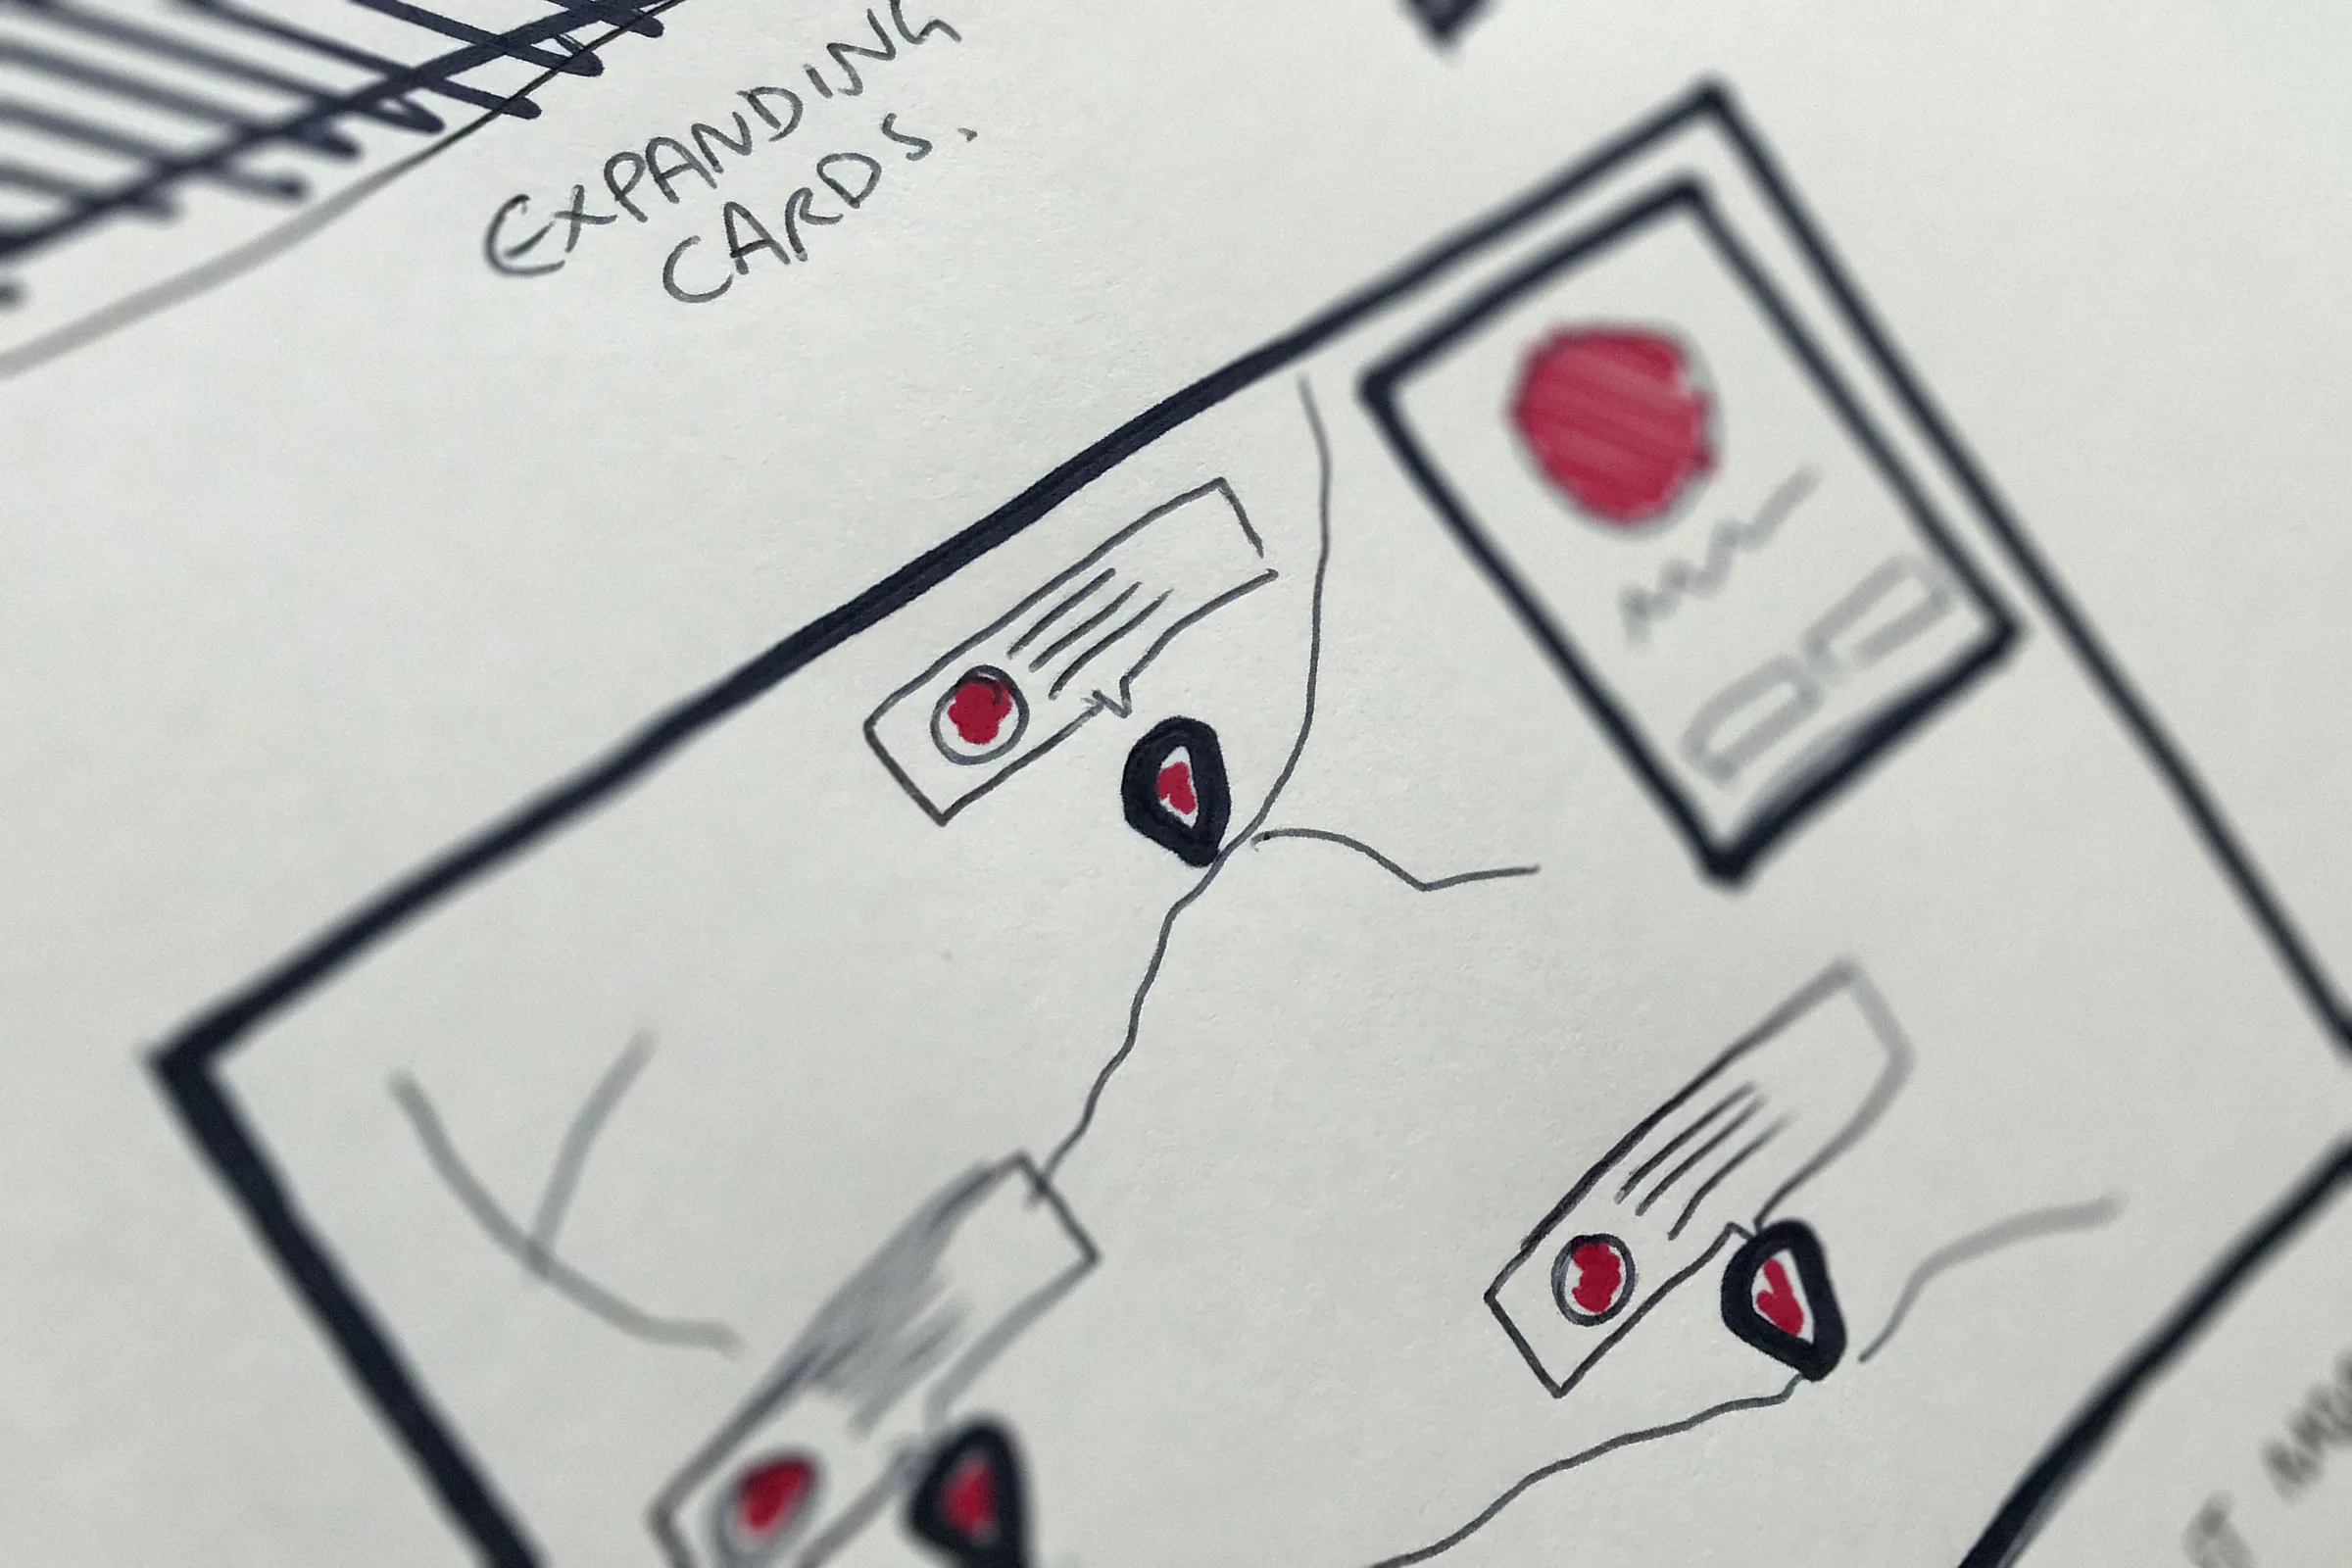
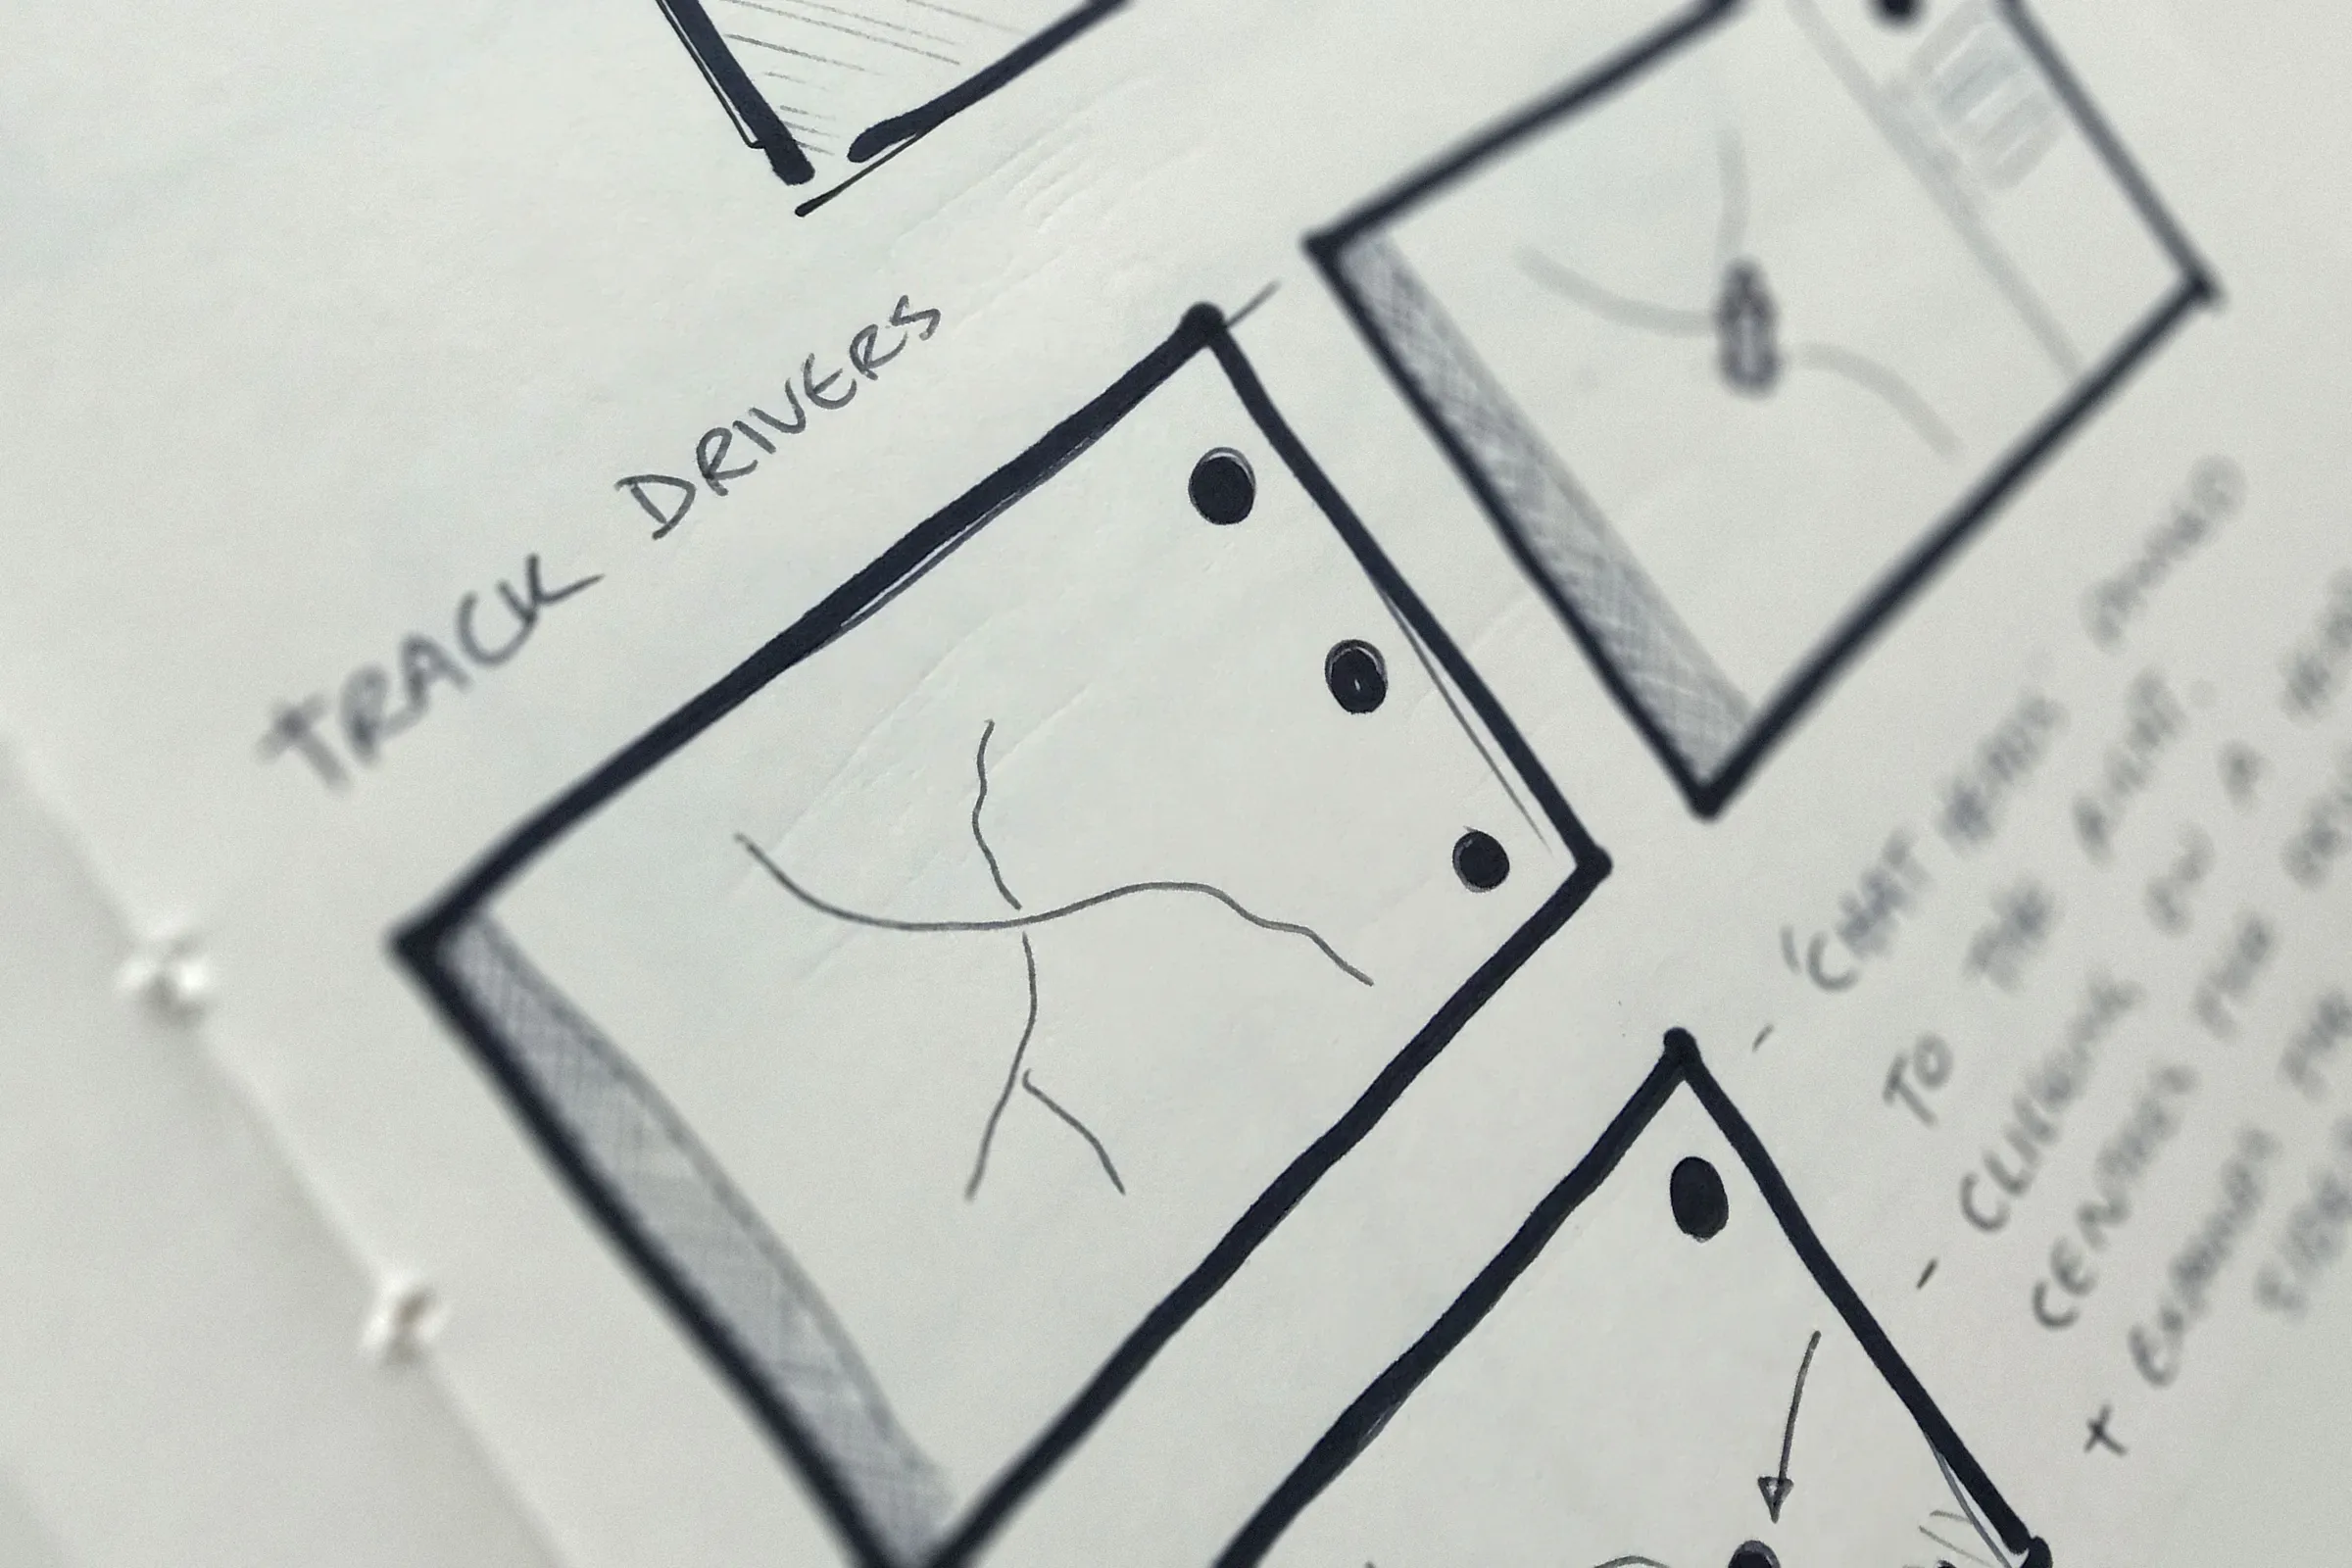
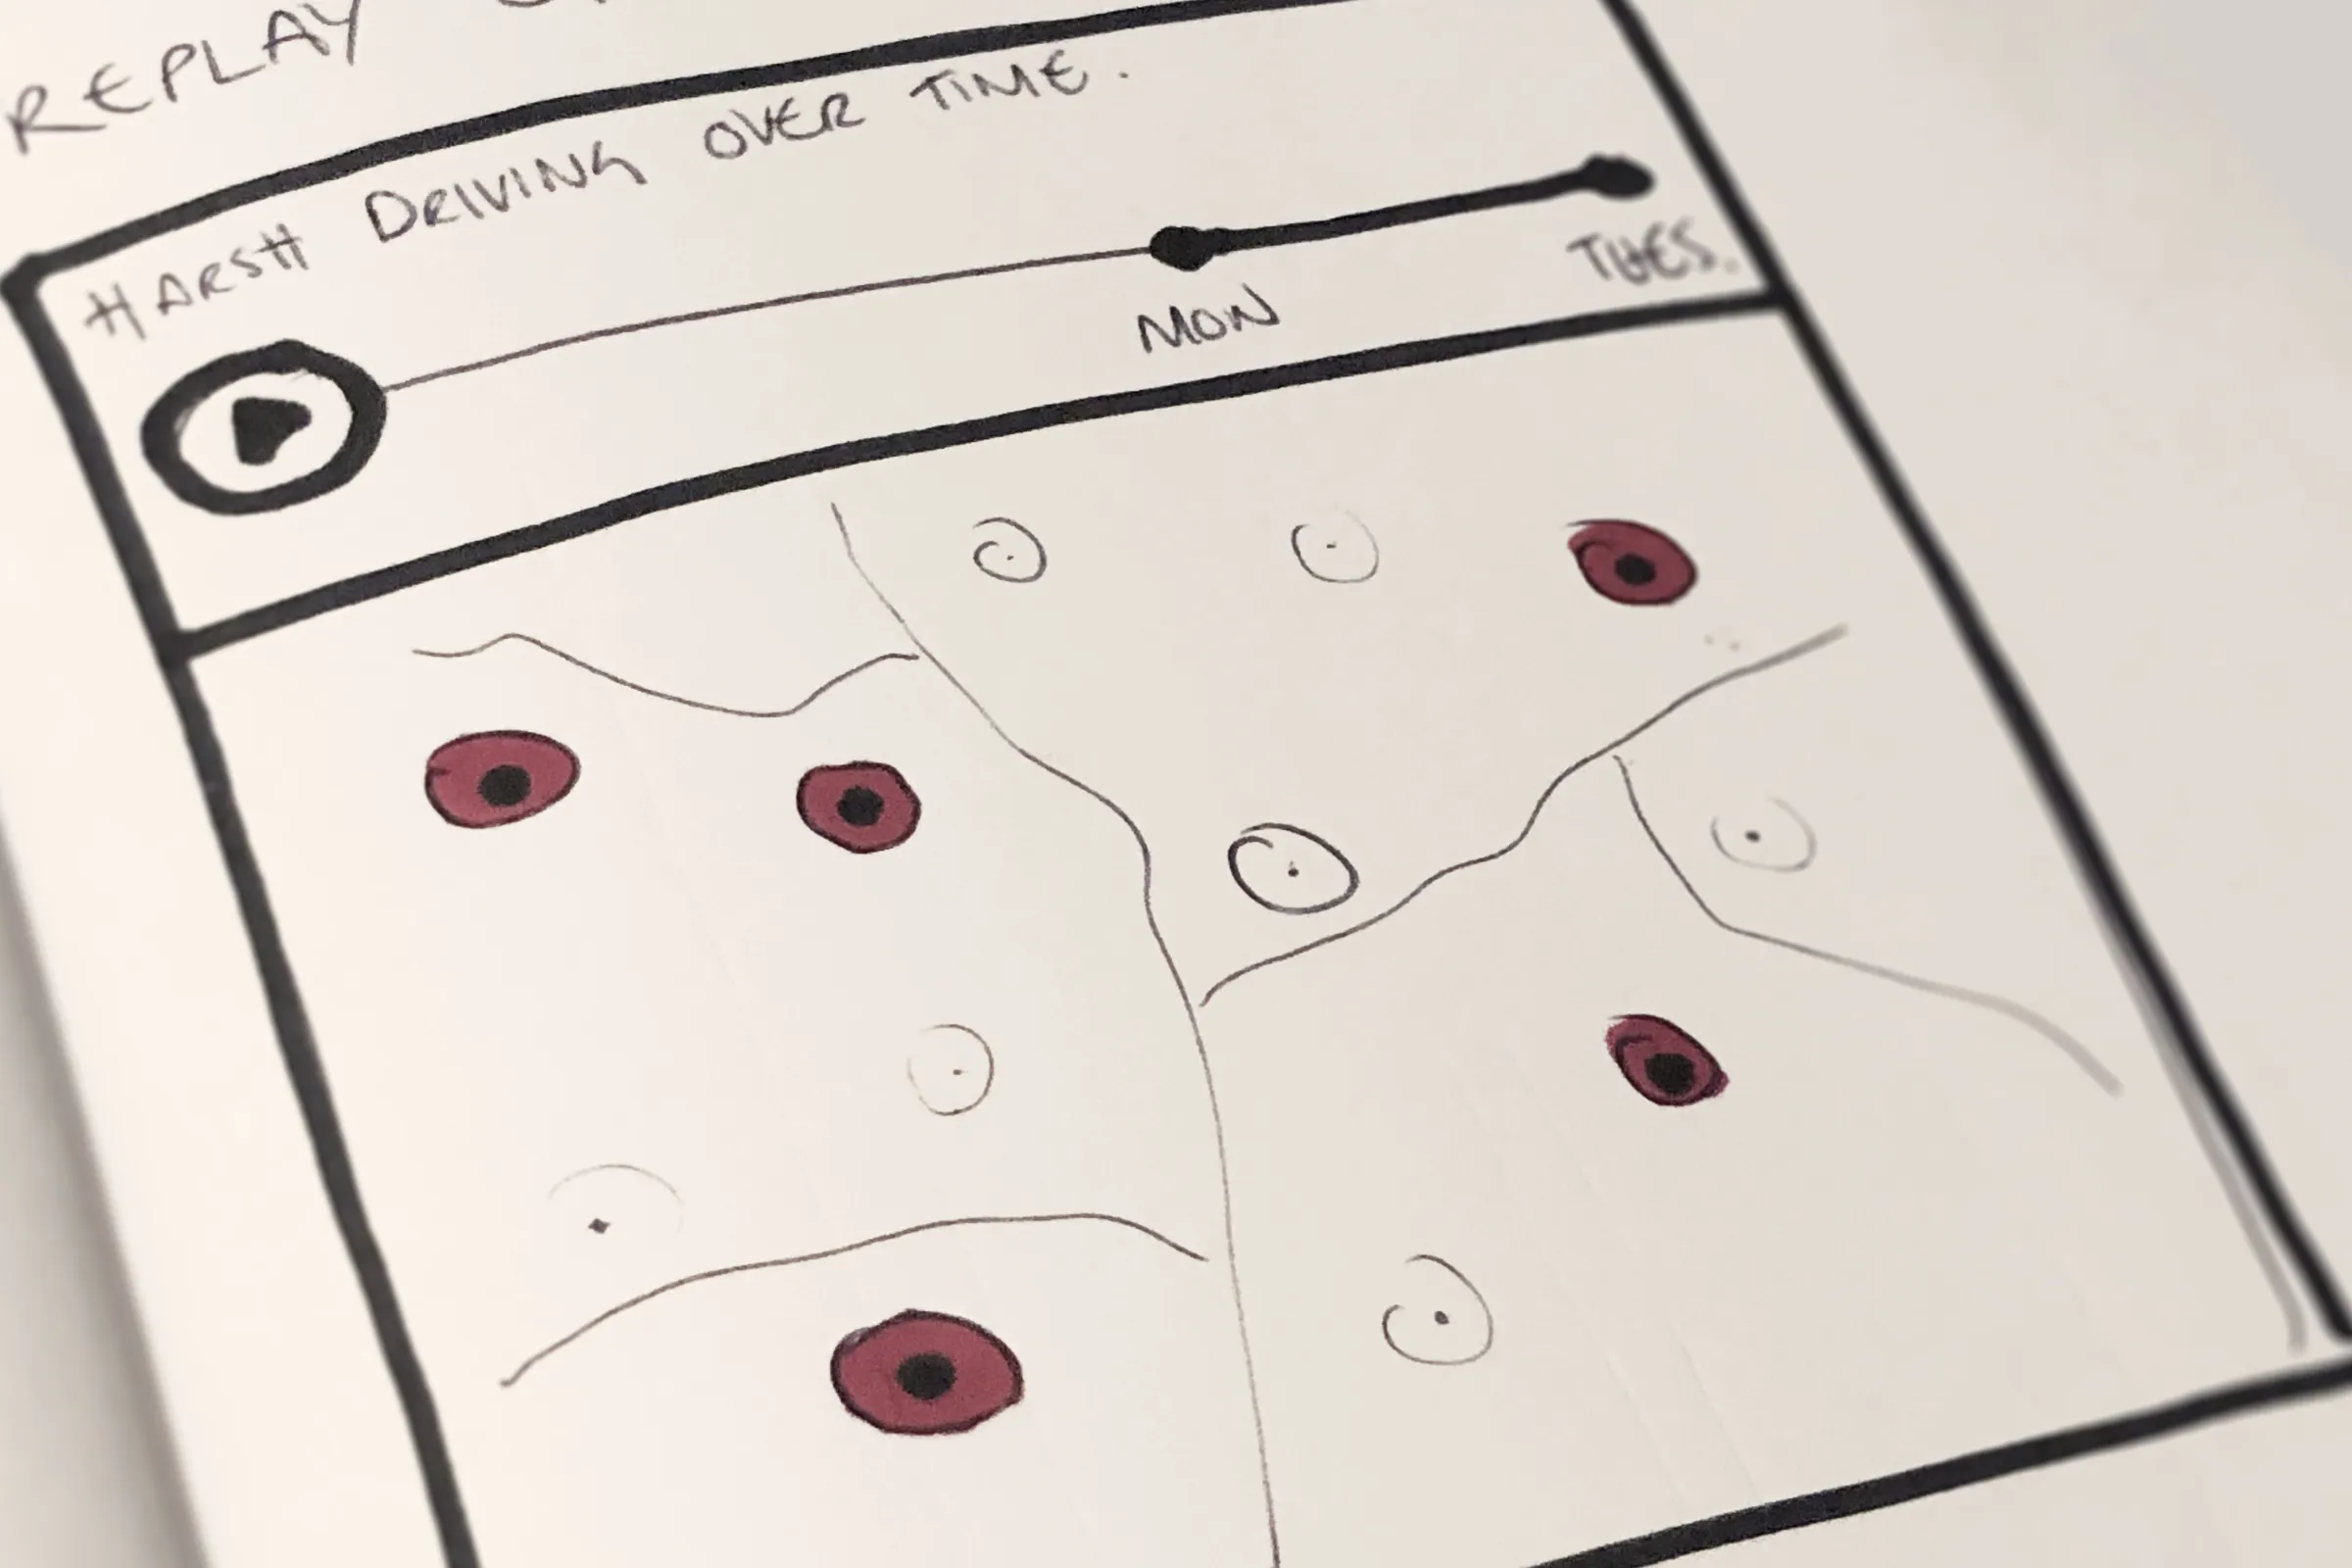
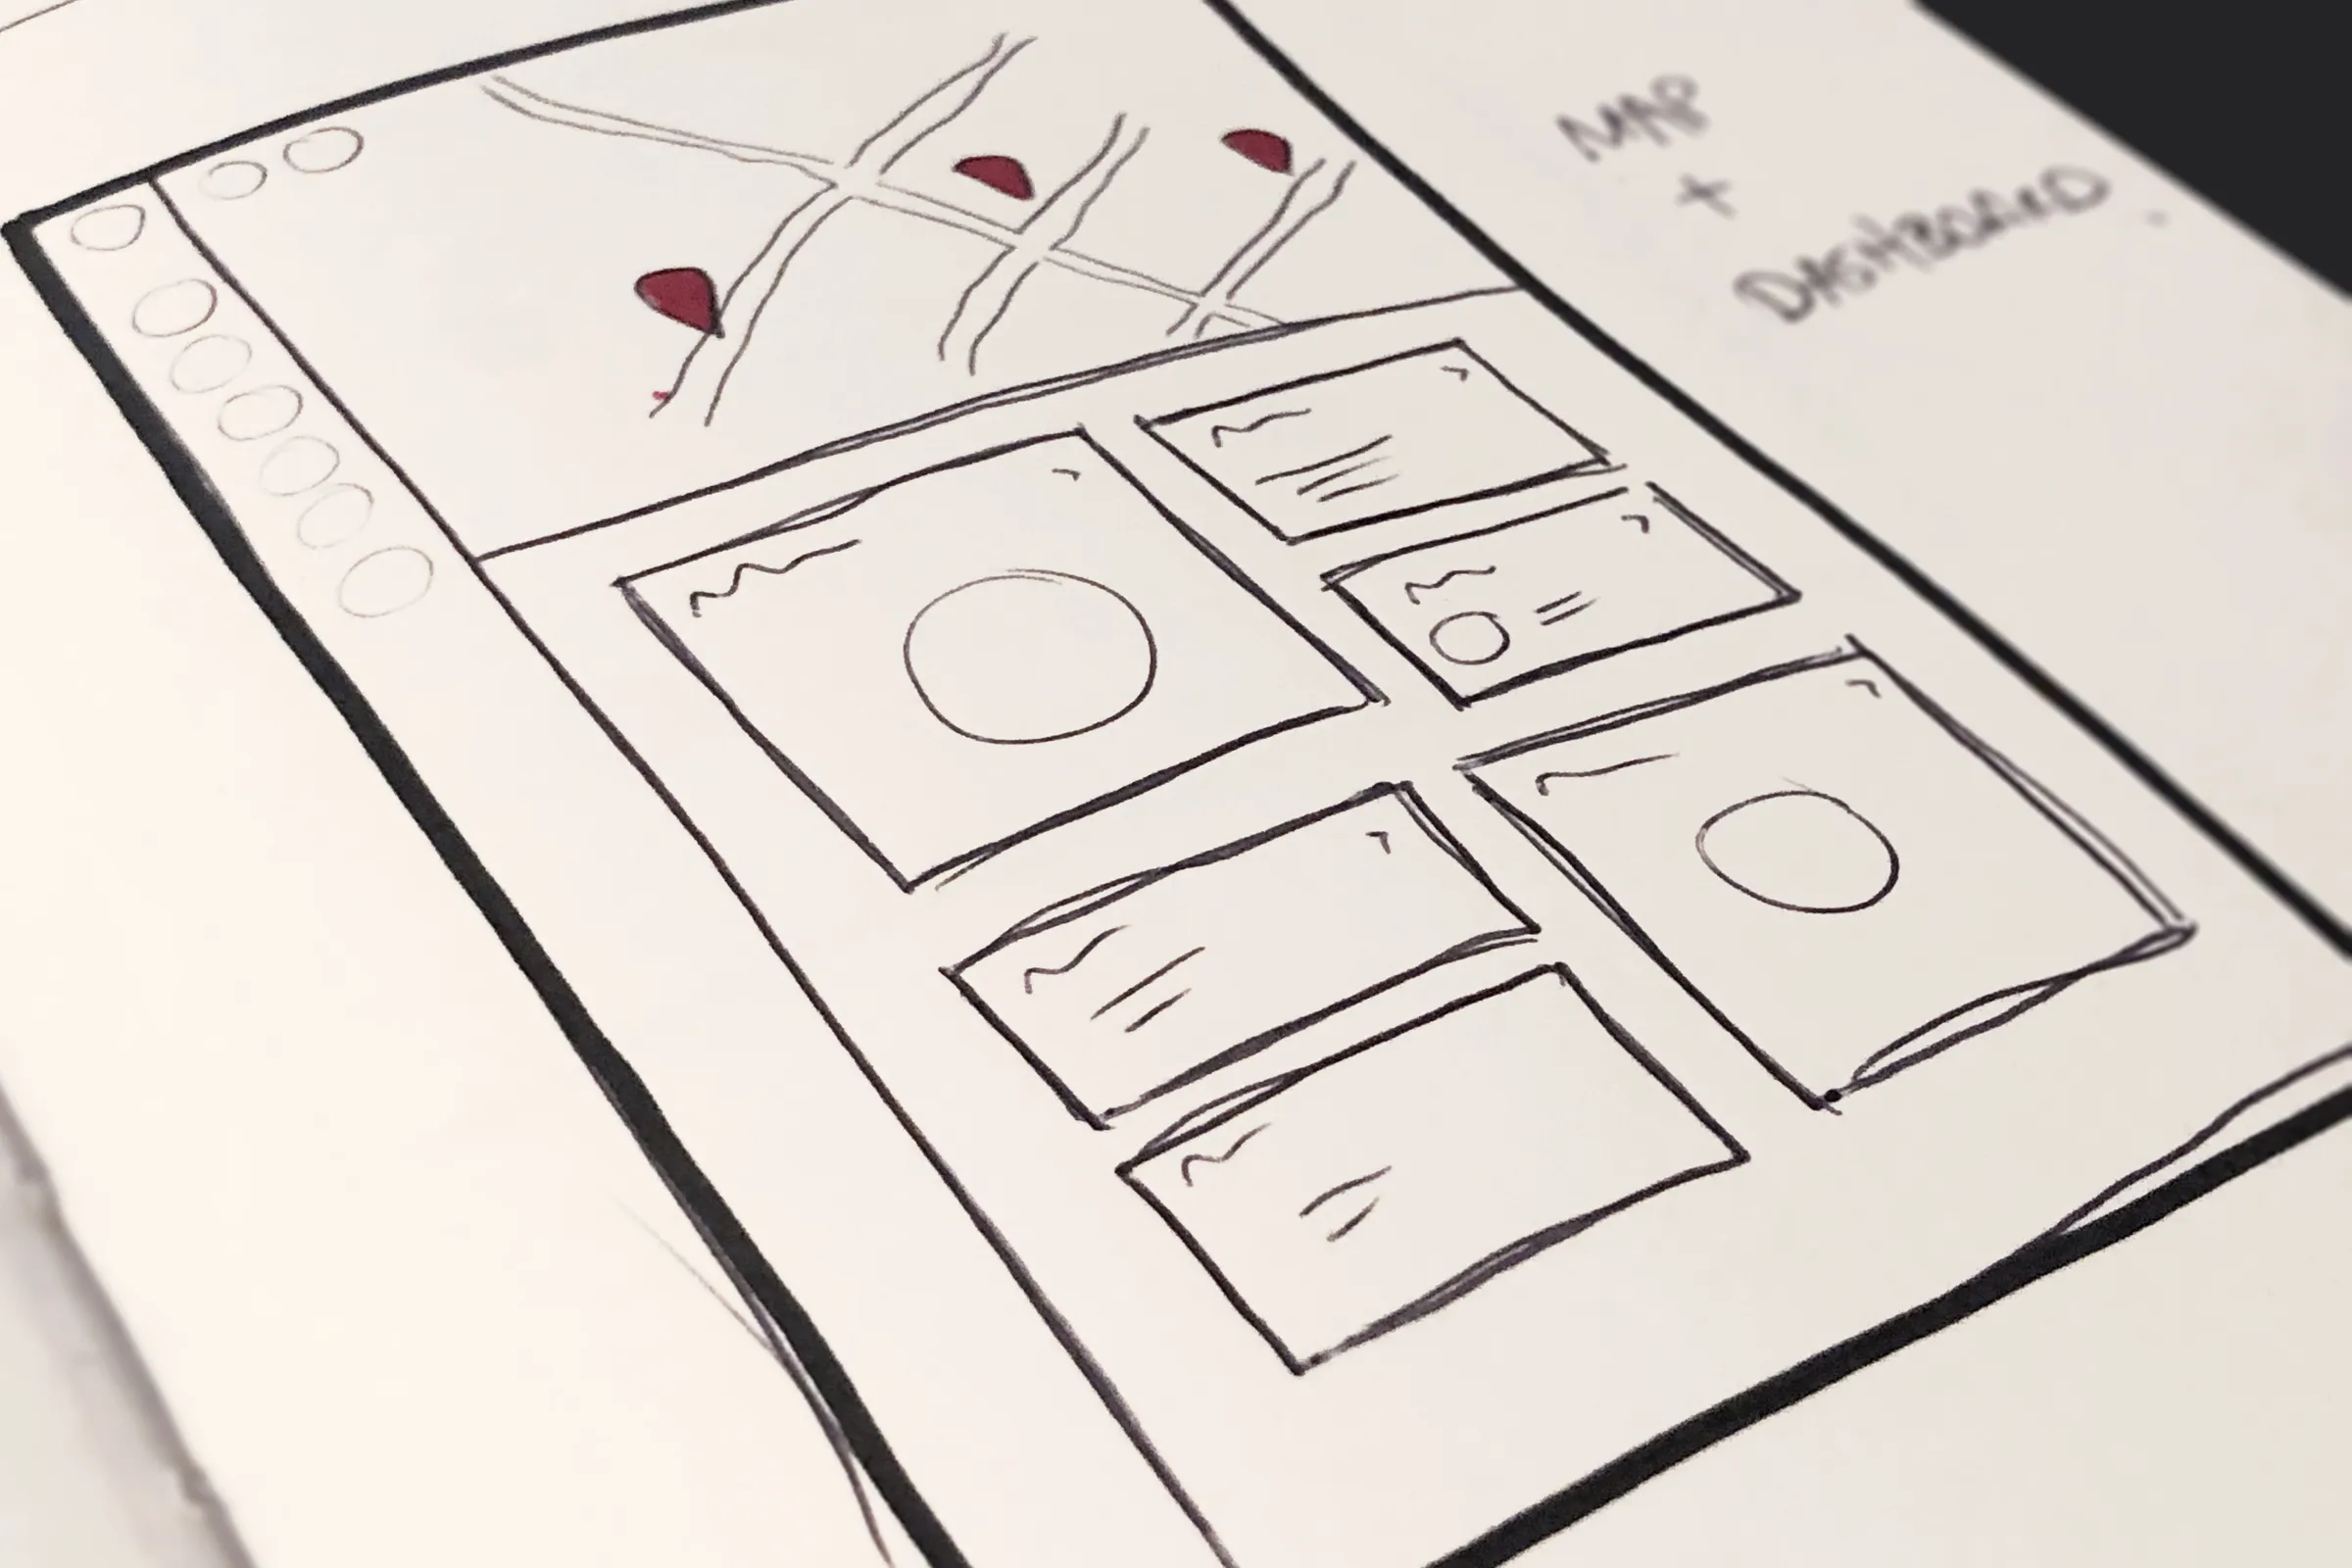
Sketches tested ways to put the map at the centre, with drivers, alerts, and reports arranged as cards around it, and explored replaying events such as harsh driving over time.
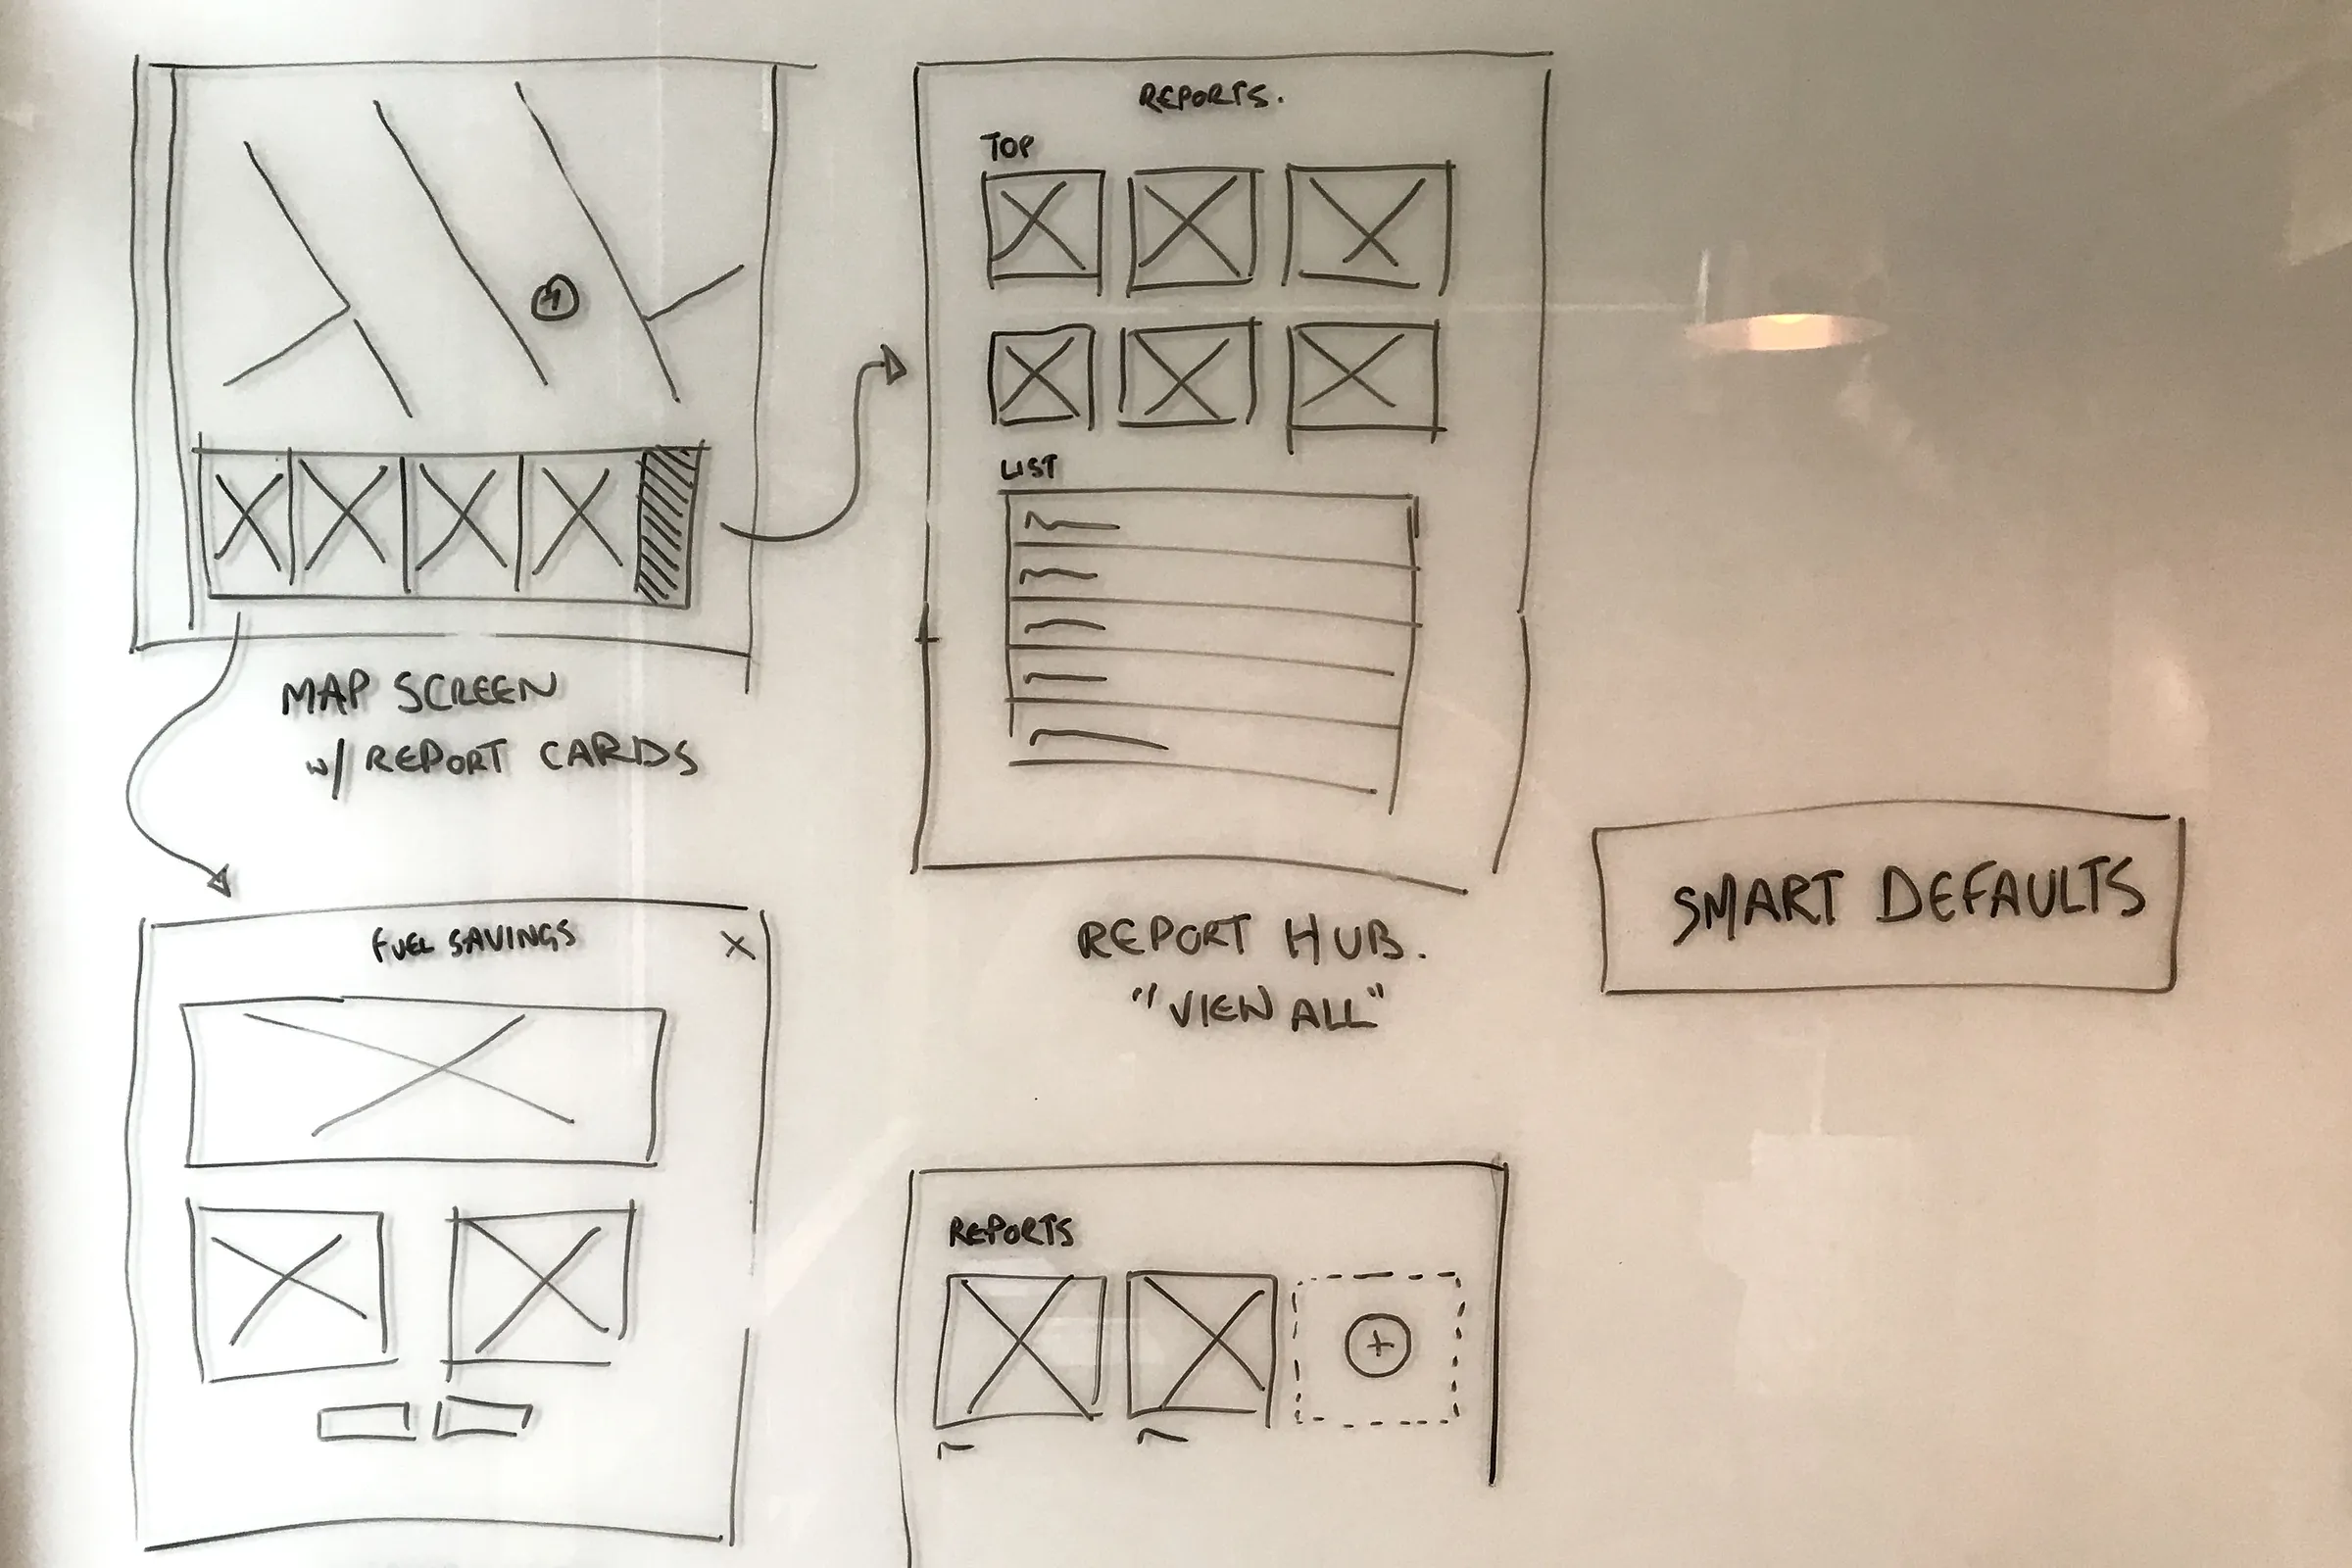
Whiteboard sketch of a map screen with report cards leading to a report hub and a fuel savings report, beside a note reading Smart Defaults
Notebook sketch of a map with red location pins above a grid of dashboard cardsNotebook sketch of map pins that open into expanding cards with driver detailsNotebook sketch labelled Track Drivers showing a map with a side panel and driver markersNotebook sketch of a replay control showing harsh driving events on a map from Monday to Tuesday

Live map & replay

On desktop, the map shows each vehicle's status and route. Selecting a driver opens their day as a timeline of jobs, and a replay bar steps back through recent trips.
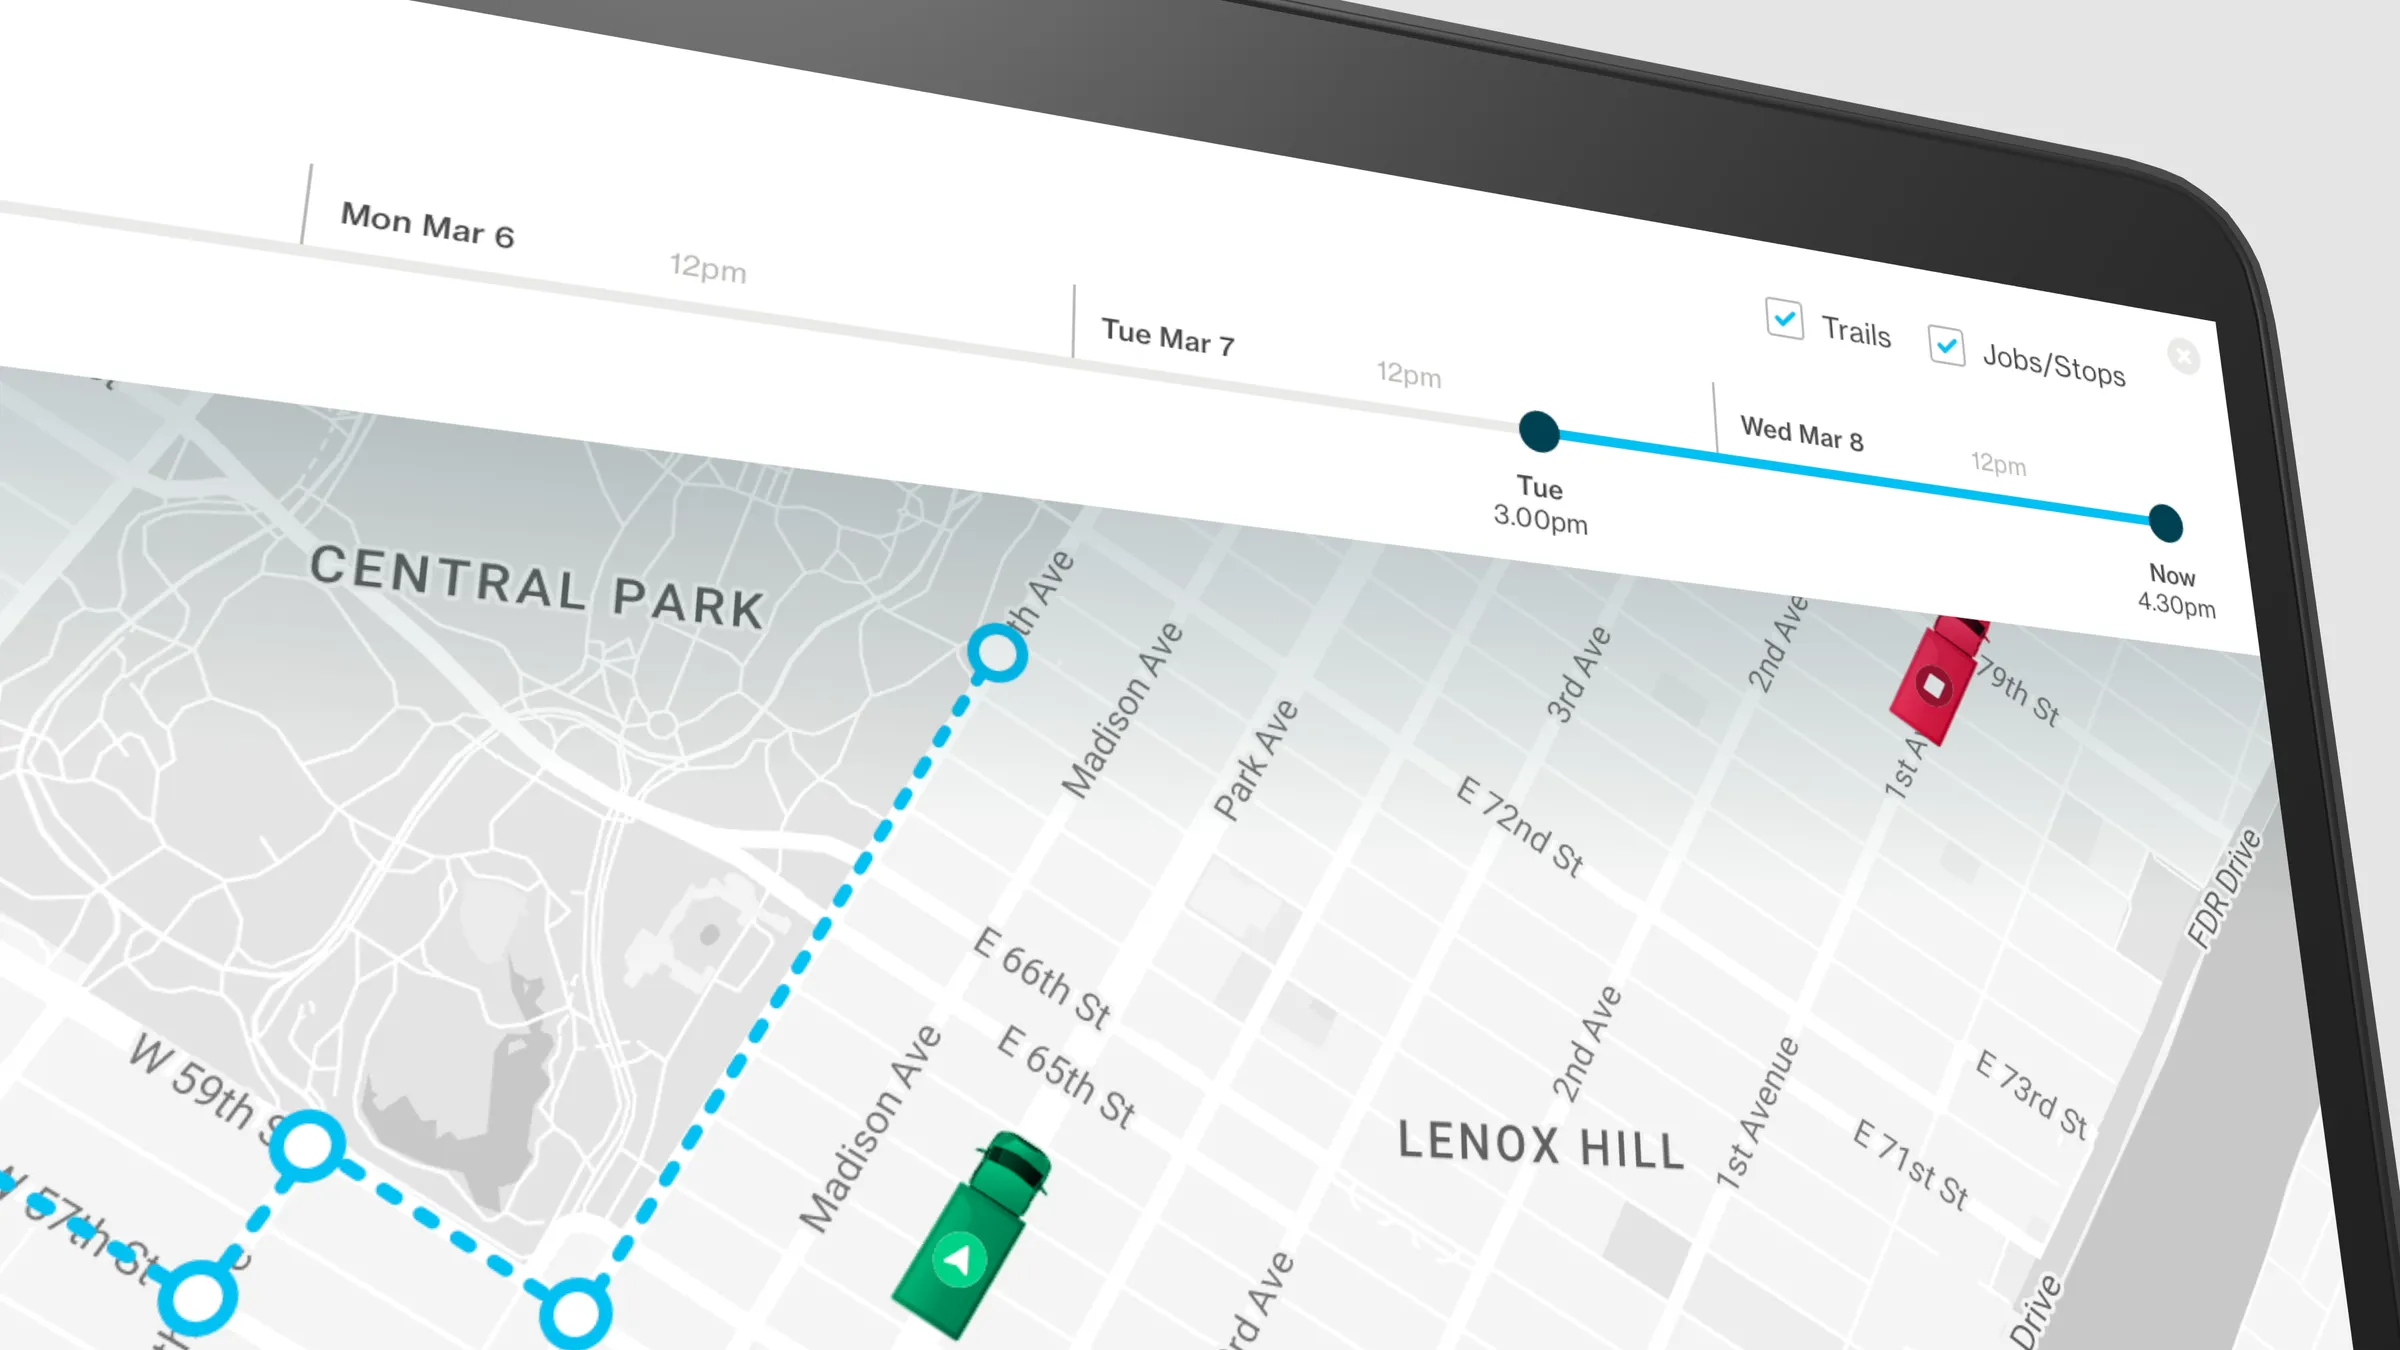
Close-up of the desktop map with a timeline from Monday to now, a dotted route through Midtown Manhattan, and red and green vehicle markers

Mobile

The mobile app gives managers the same view away from their desk: vehicles on a map, driver cards that flag warnings, and quick detail on events such as speeding.
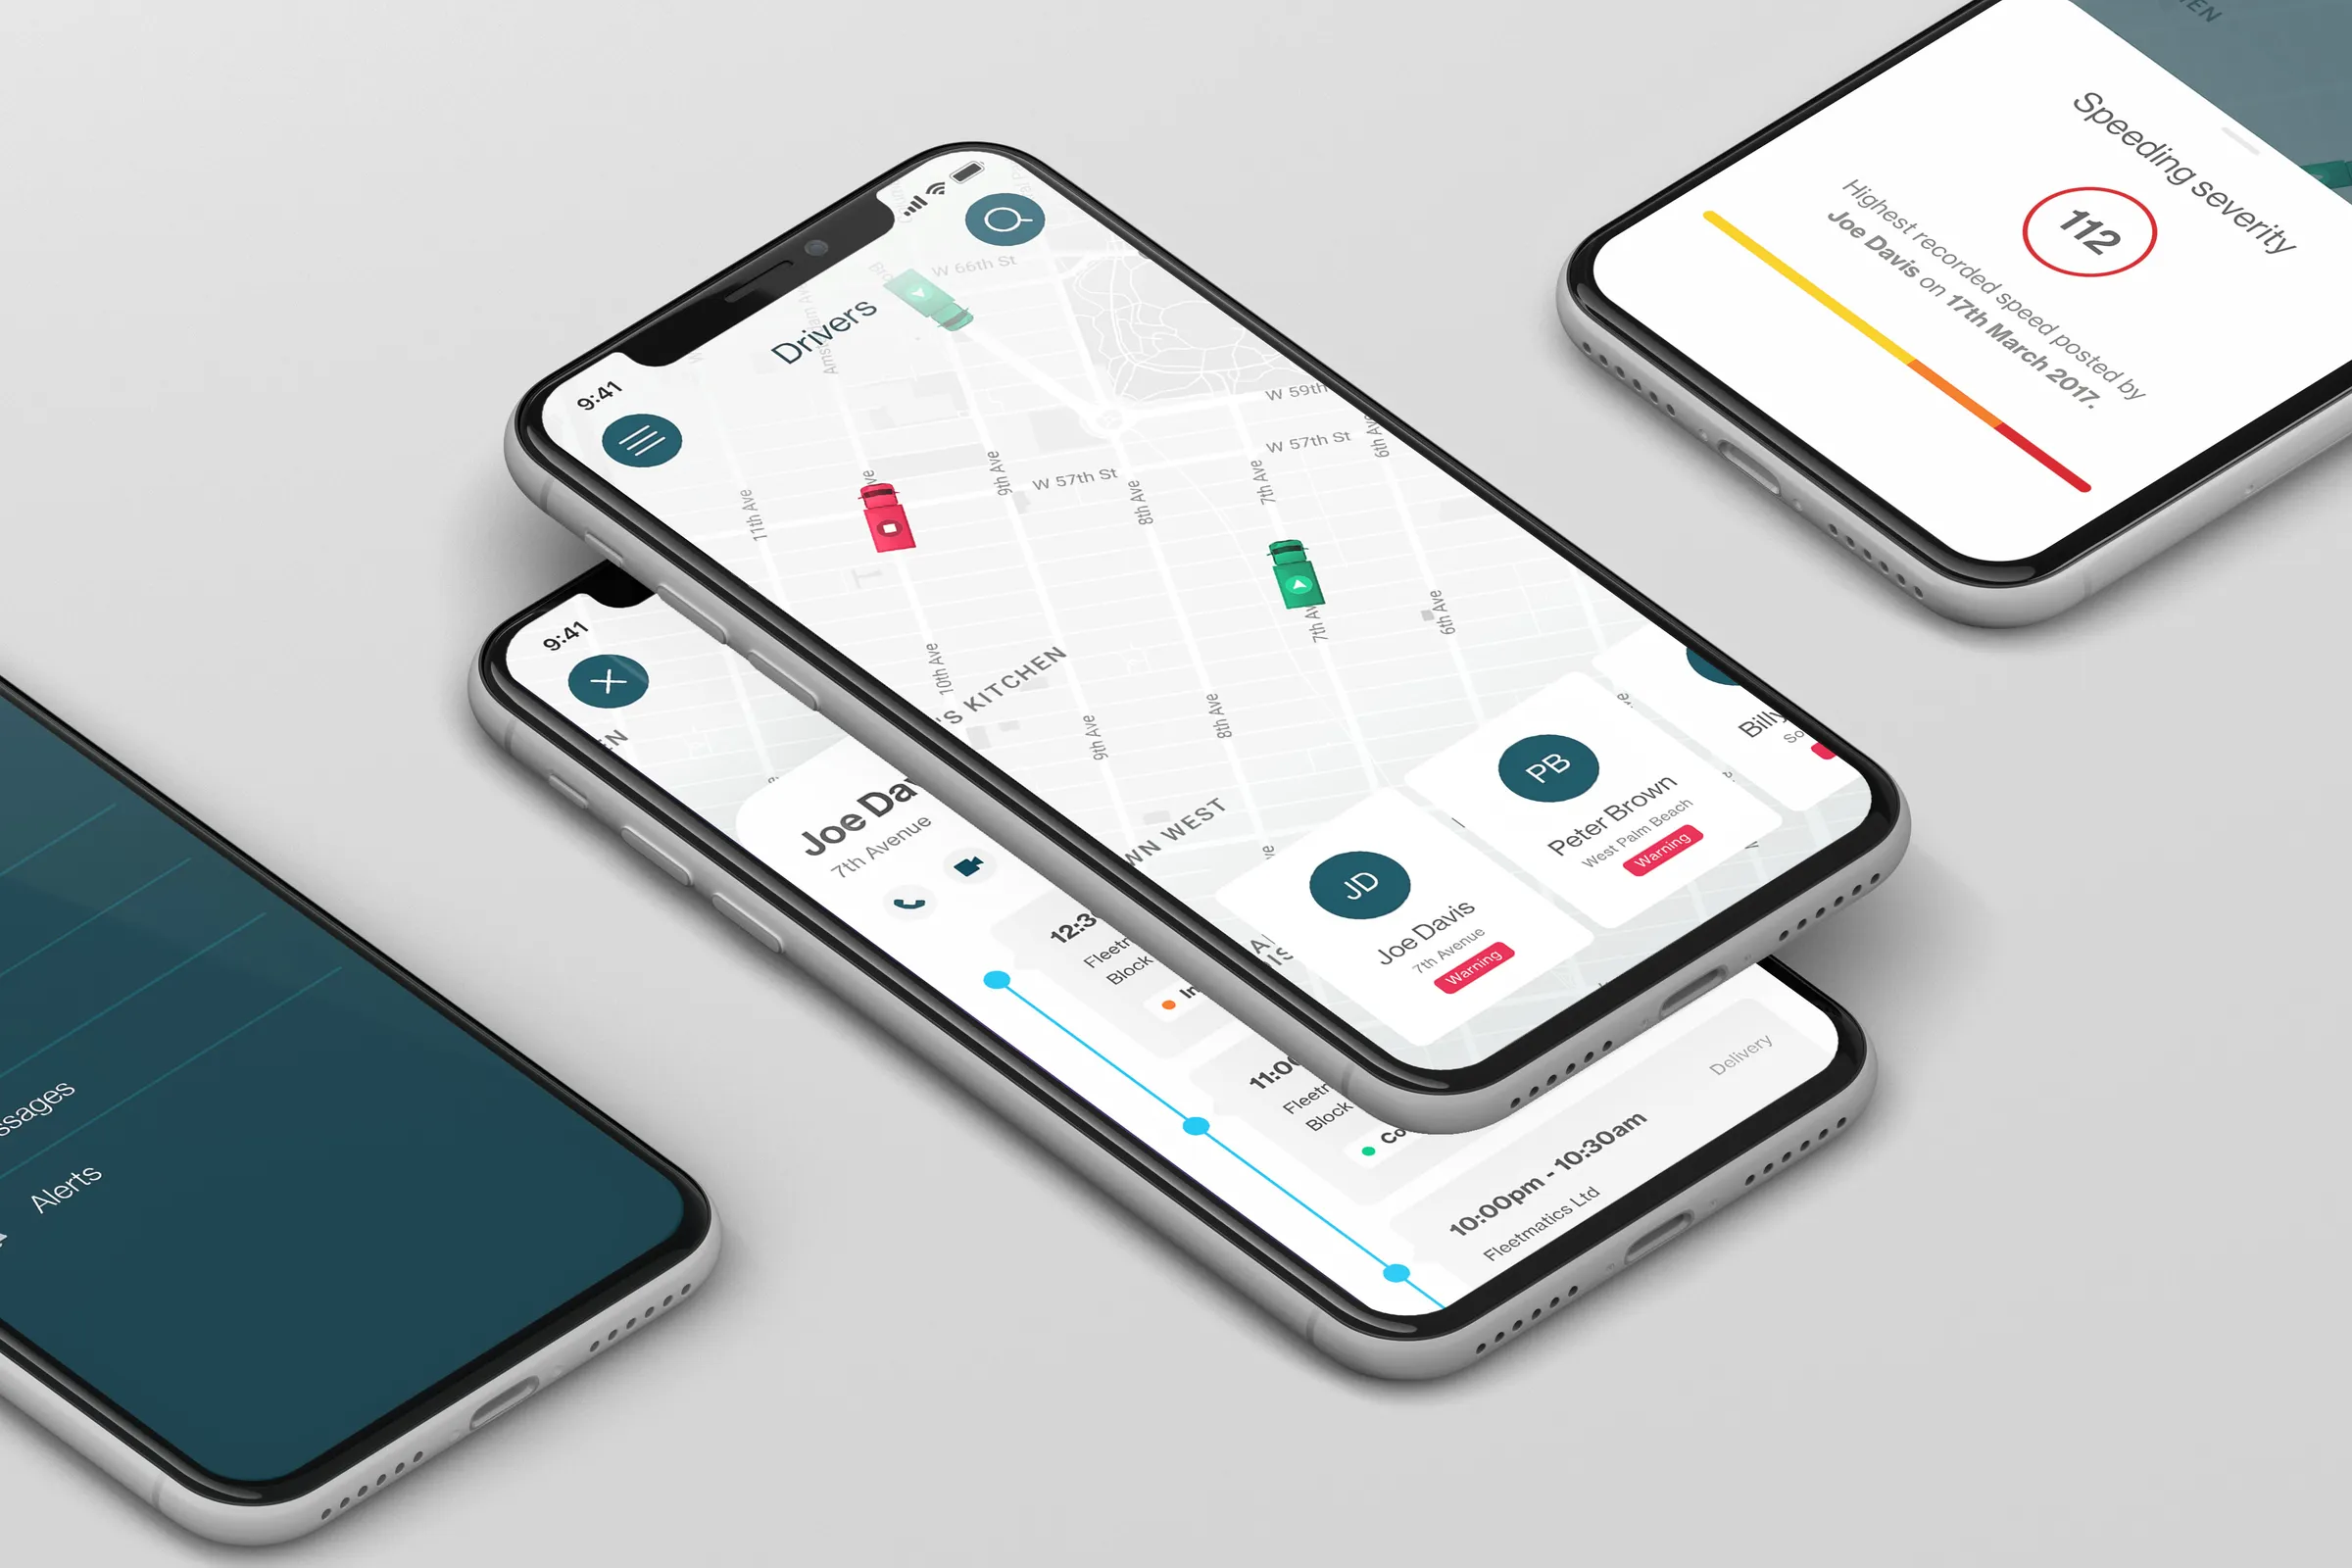
Phones showing the navigation menu, the Drivers map with driver cards, a driver's job timeline, and a speeding severity alert

Driver logbook

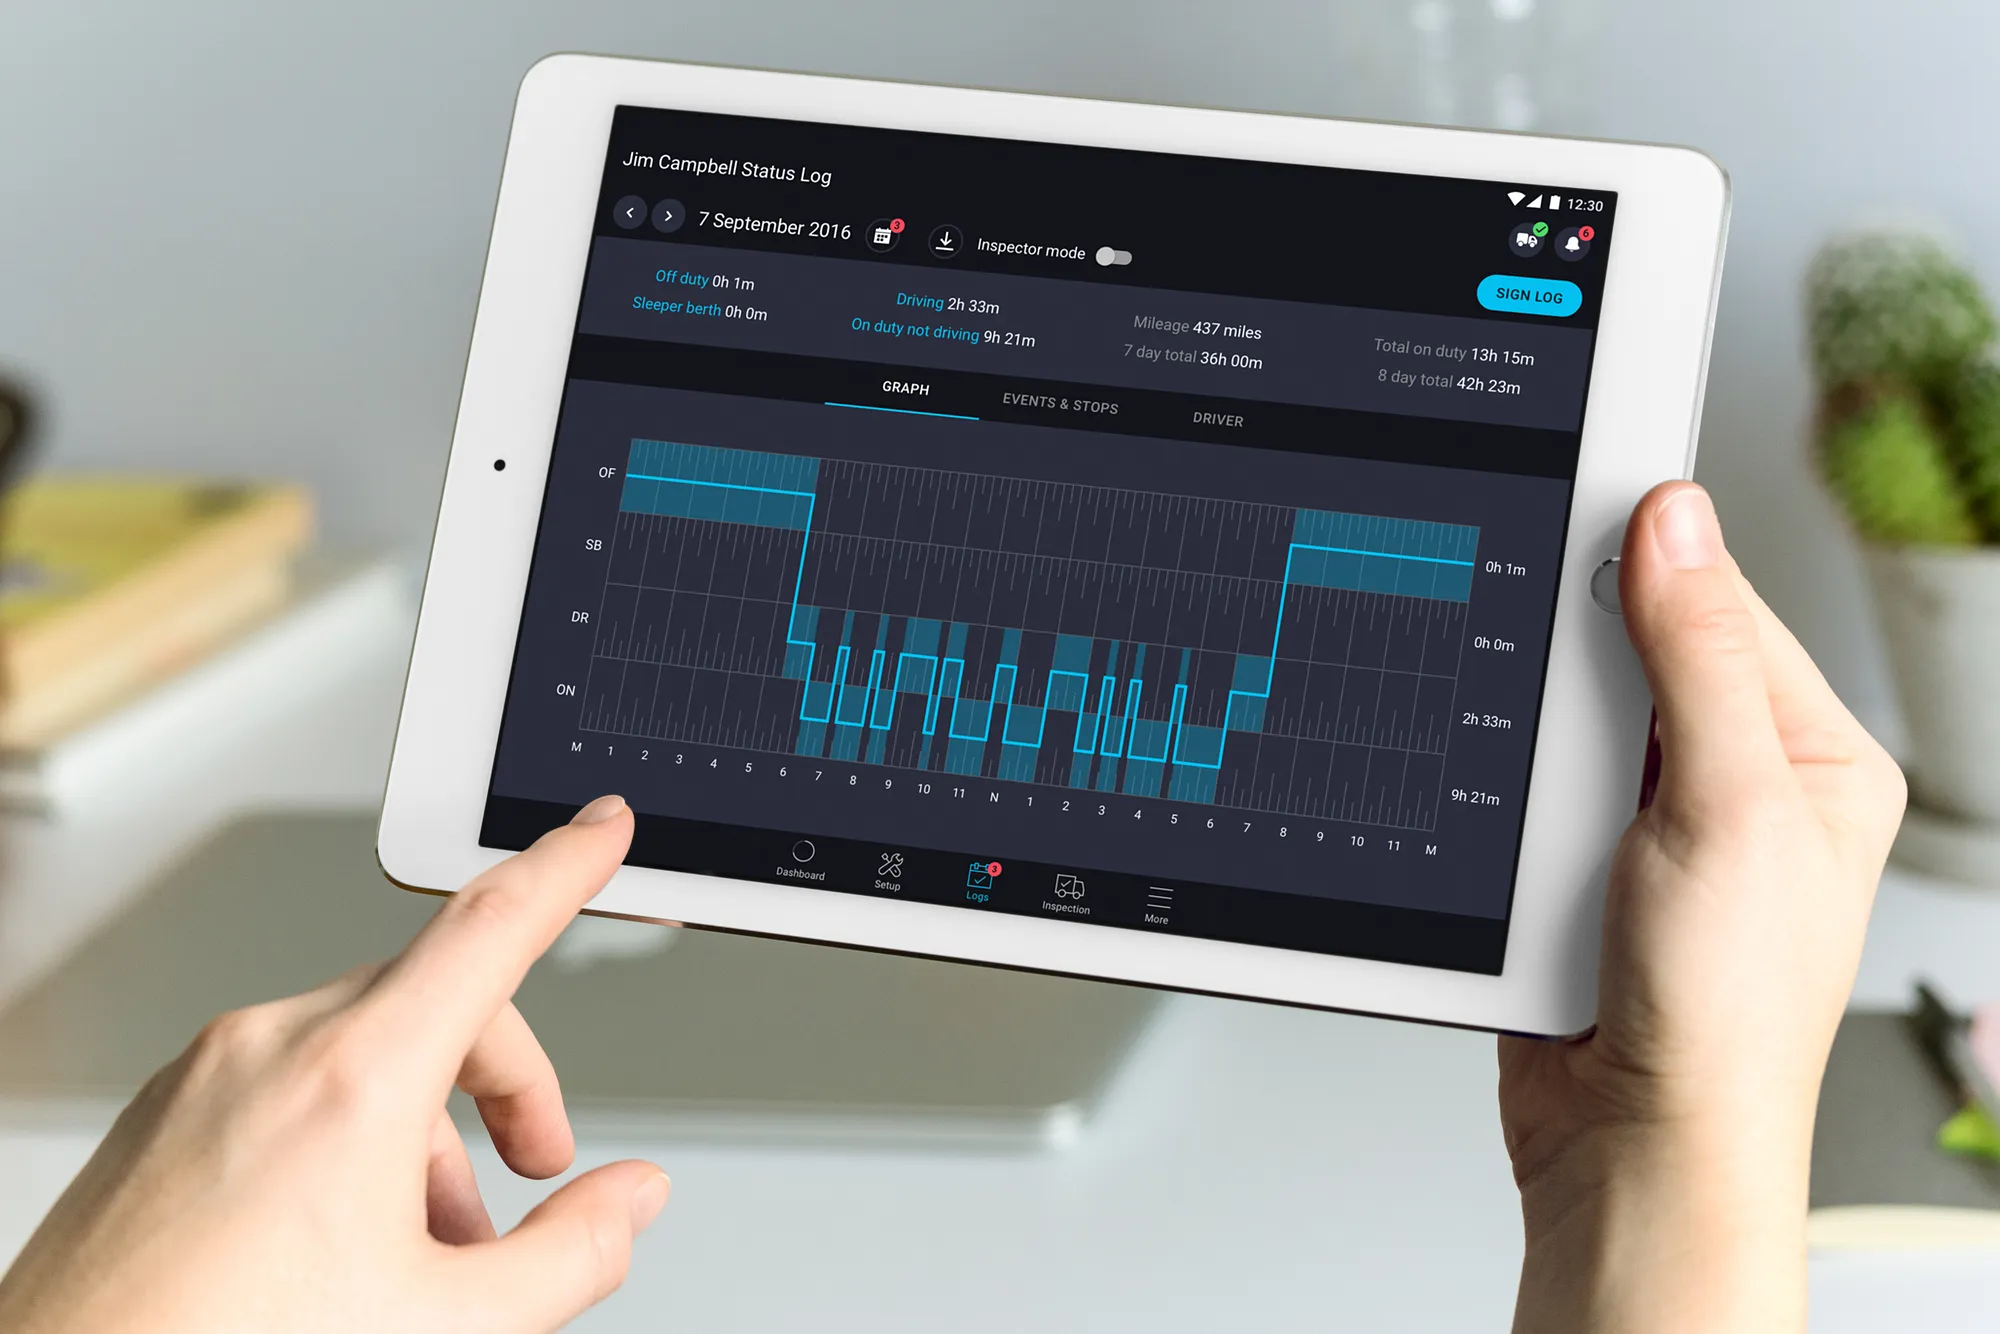
A tablet logbook lets drivers record their hours of service. The dashboard shows current driving time and when a break is due, and the log graphs each day's duty status for review or inspection.
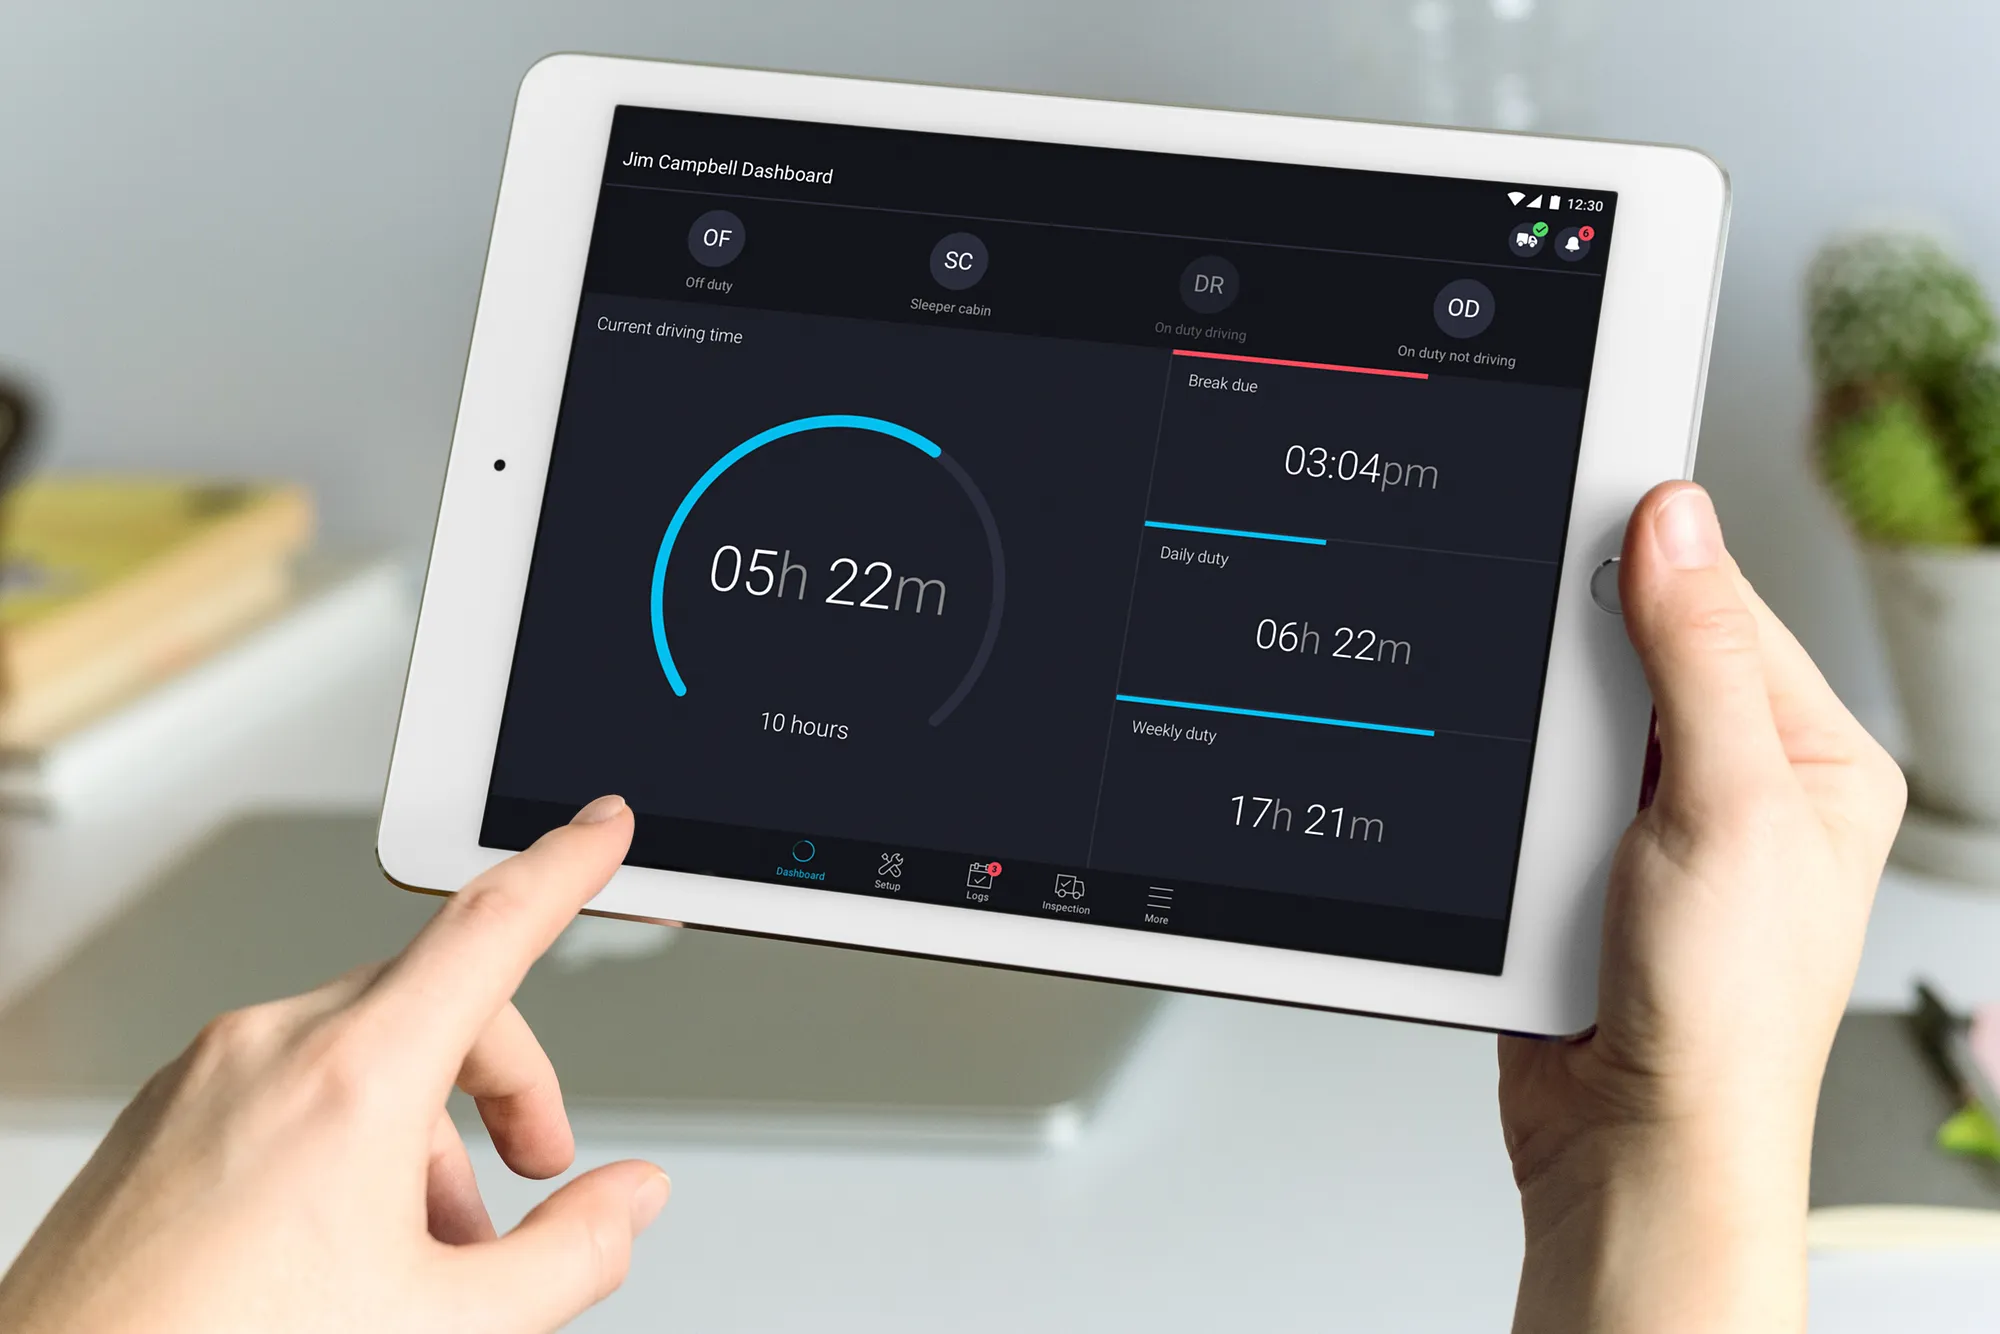
Tablet logbook dashboard showing 5 hours 22 minutes of driving time, a break due at 3:04pm, and daily and weekly duty totals
Tablet status log graphing a driver's day across off duty, sleeper berth, driving, and on duty, with daily totals and a Sign Log button